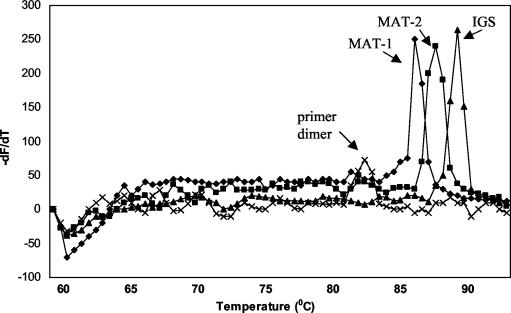
FIG. 4.
Melting curves of F. circinatum DNA amplicons as measured by real-time PCR. Displayed is the negative first derivative of the fluorescence-versus-temperature plot over temperature (−dF/dT versus temperature). Fragments of the IGS region and the two mating type genes (MAT-1 and MAT-2) can be distinguished by their respective melting temperatures, which are a function of percent G+C content and fragment length. Primer dimers (if present) show a melting peak at ca. 82°C.

