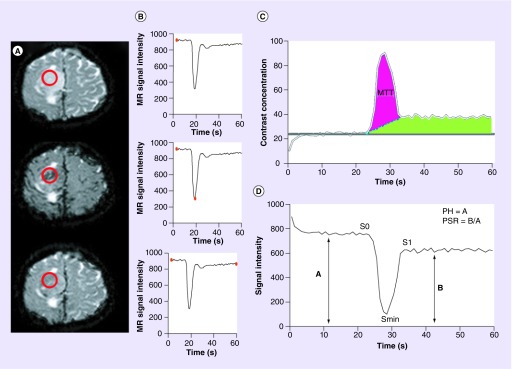
Figure 1. . Calculation of dynamic susceptibility-weighted contrast-enhanced perfusion MRI parameters; peak height, percentage of signal intensity recovery and cerebral blood volume.
(A & B) Precontrast bolus (top), peak bolus (middle), and post-contrast bolus (bottom) T2* axial images from a patient with right convexity glioma. (A) Demonstrates the changes in signal intensity (darkened vasculature) caused by the rapid intravascular bolus of paramagnetic contrast agents. Placement of a region of interest (red circle) over the lesion allows for the measurement of signal intensity (B) at any given time point during dynamic imaging sequence (red dot on graph bar). Generation of (C) a contrast concentration–time and (D) signal intensity–time curves allows for the quantification of perfusion metrics. (C) Idealized illustration of cerebral blood volume quantification in the setting of a disrupted blood–brain barrier. Two quantification methods are depicted. Baseline subtraction method (blue dashed line) can be applied allowing for the calculation of cerebral blood volume which is proportional to the area under the concentration–time curve (purple shaded area). Alternatively, the negative enhancement integral method utilizes the contrast concentration prior to the bolus phase of imaging (gray bar) to estimate the end bolus contrast concentration and calculates the area within the first pass bolus of contrast without consideration of the recirculation phase (green shaded area). Mean transit time is calculated as the half width maximum of the contrast concentration-time curve (gray bars). (D) PH is calculated as S0–Smin, where S0 is the precontrast bolus baseline signal intensity and Smin is the minimum signal intensity obtained during the first pass bolus phase of contrast (double-headed arrow A). PSR is calculated as (S1–Smin/S0–Smin), where S1 is the average post-bolus signal intensity (double-headed arrow B).
For color images please see online http://www.futuremedicine.com/doi/full/10.2217/cns.14.44
MR: Magnetic resonance; PH: Peak height; PSR: Percentage of signal intensity recovery.

