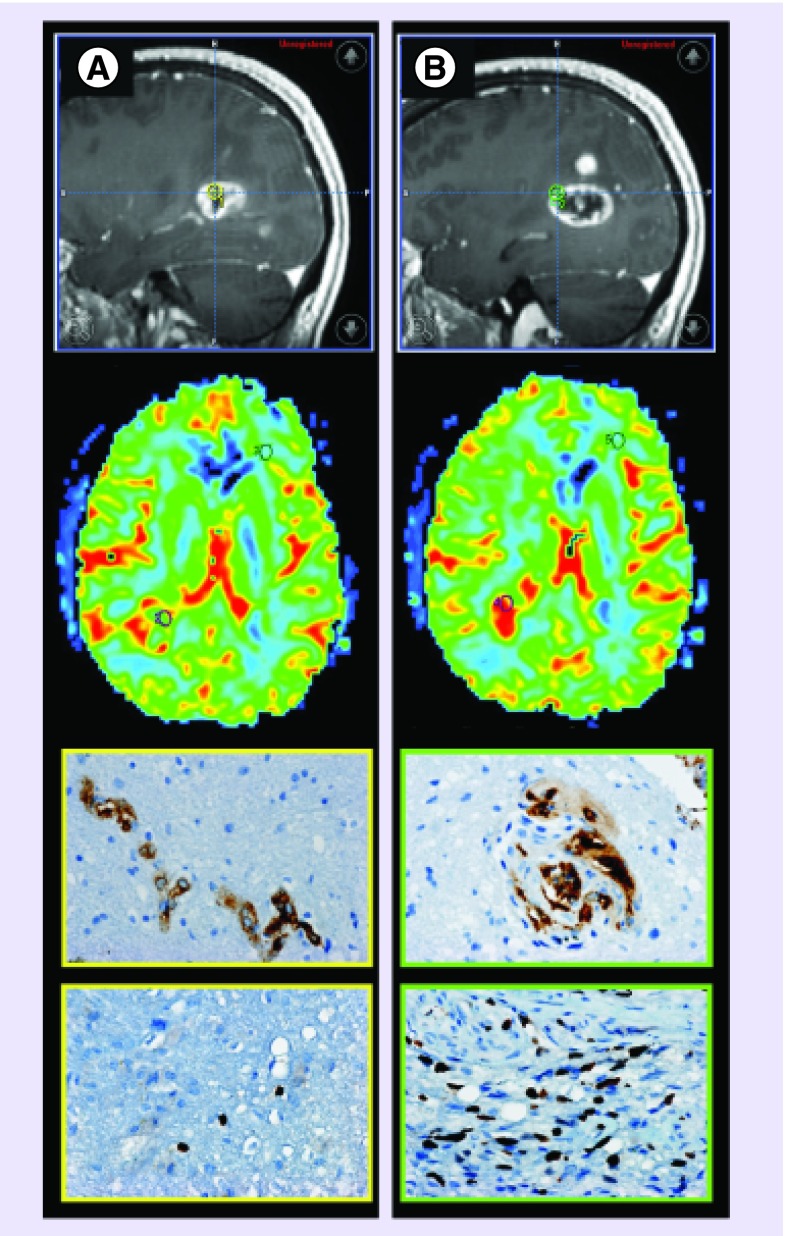
Figure 2. . MRI-guided tissue sampling demonstrates glioblastoma biological heterogeneity.
(A & B) Similar appearing contrast-enhancing foci (first row, yellow circle, [A]; green circle, [B]) demonstrates dissimilar biological features of glioblastoma aggressiveness. (A) Enhancing tissue sampling site with mildly elevated cerebral blood volume (CBV) and peak height (second row, axial CBV map reformation, purple regions of interest corresponds to tissue sampling site) demonstrates simple microvascular hyperplasia (third row, factor VIII brown stained cells) without elevation of cellular proliferation (fourth row, Ki-67 proliferative index less than 1%). (B) Similar appearing enhancing foci demonstrates markedly increased CBV and peak height with complex glomeruloid microvascular hyperplasia (factor VIII brown stained cells) with elevated cellular proliferation (Ki-67 proliferative index of 20%). This case demonstrates the nonspecificity of contrast enhancement and the additional value of dynamic susceptibility-weighted contrast-enhanced perfusion MRI metrics for the selection of biologically aggressive tumor sites.
Pathologic images courtesy of Joanna J Phillips (Departments of Pathology and Neurological Surgery, University of California, San Francisco, CA, USA).

