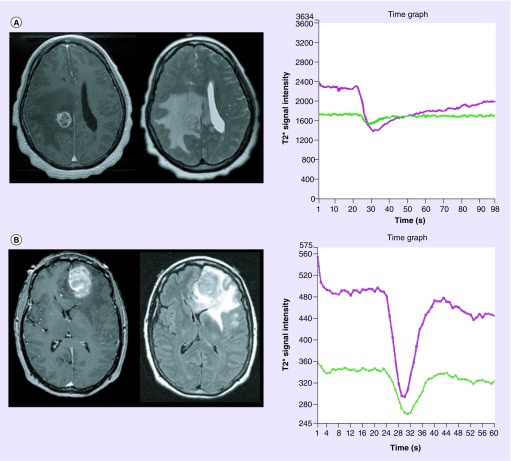
Figure 3. . Dynamic susceptibility-weighted contrast-enhanced perfusion metrics differentiate intracranial metastatic disease from gliomblastoma.
Axial T1 postcontrast-enhanced (left) and T2 (top middle) fluid-attenuated inversion recovery (bottom middle) images demonstrate similar appearing lesions. Signal intensity–time curves (right) generated from lesion wide region of interest (not shown) in a patient with (A) metastatic lung cancer and (B) glioblastoma differentiates disease etiology utilizing perfusion metrics. Metastatic lesion demonstrates markedly reduced percentage of signal intensity ([A] purple curve) when compared with normal appearing white matter ([A] green curve) and glioblastoma ([B] purple curve). Additionally, cerebral blood volume and peak height measurements are elevated within glioblastoma when compared with metastatic lesions.
For color images please see online at http://www.futuremedicine.com/doi/full/10.2217/cns.14.44

