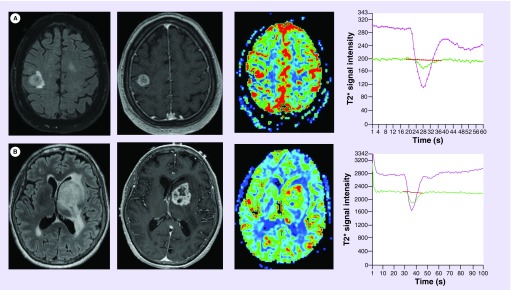
Figure 6. . EGFR-mutated primary glioblastoma demonstrates differential dynamic susceptibility-weighted contrast-enhanced perfusion metrics.
(A) Fluid-attenuated inversion recovery (left) and T1-weighted postcontrast (middle left) images demonstrate a rim enhancing mass found to represent an EGFR-mutated primary glioblastoma. Cerebral blood volume map (middle right) and signal intensity–time curve (right) demonstrates markedly elevated relative cerebral blood volume (8.2) and relative peak height (9.2) about the enhancing foci. (B) Fluid-attenuated inversion recovery and T1-weighted post contrast images demonstrate a similar appearing rim enhancing mass found to represent a primary glioblastoma without EGFR mutation. Cerebral blood volume map and signal intensity–time curve demonstrates moderately elevated relative cerebral blood volume (3.7) and relative peak height (2.7) about the enhancing foci. While both tumors demonstrates elevated dynamic susceptibility-weighted contrast-enhanced perfusion metrics, the EGFR-mutated tumor does so to a significantly higher degree.

