
FIGURE 5.
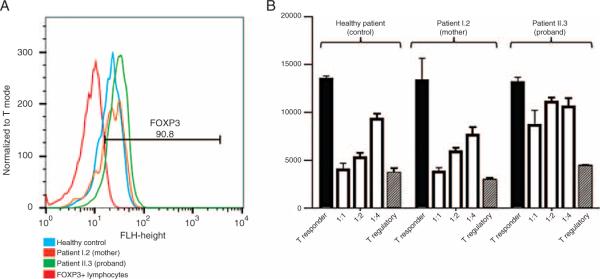
A, Profile of flow cytometry analysis for FOXP3 (FL1 channel) staining in CD4+CD25+IL7Rlo peripheral lymphocytes isolated from healthy control (blue), proband's mother (brown), and proband (green) demonstrating >90% enrichment for FOXP3+ lymphocytes (red line, isotype control). B, CD4+CD25+IL7Rlo Tregs are cocultured with increasing titer of CD4+CD25− T responders (open histograms) from the same healthy control. Healthy control and patient I.2 demonstrate normal suppressive function with increasing titer. Patient II.3 suppresses poorly, even at a 1:1 ratio.