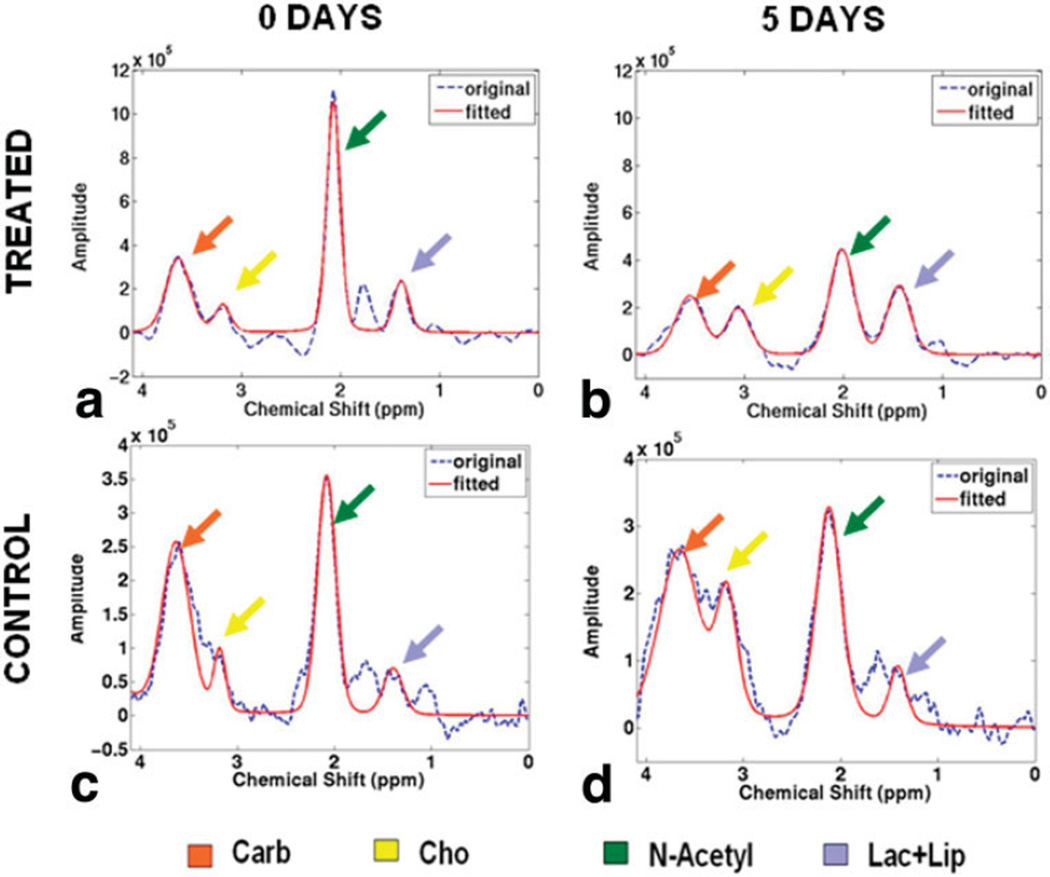
FIG. 2.
Representative MR single-voxel spectra acquired in a bovine disc before (a) and 5 days after (b) papain injection vs. the spectra acquired in a control bovine disc at the same time points: before (c) and 5 days after (d). Note the significant decrease of N-acetyl peak height. In comparison, no significant differences were found in the control bovine disc between the two time points. The dash blue lines represent the acquired spectra, the solid red line represent the fitted spectra for peak area quantification.

