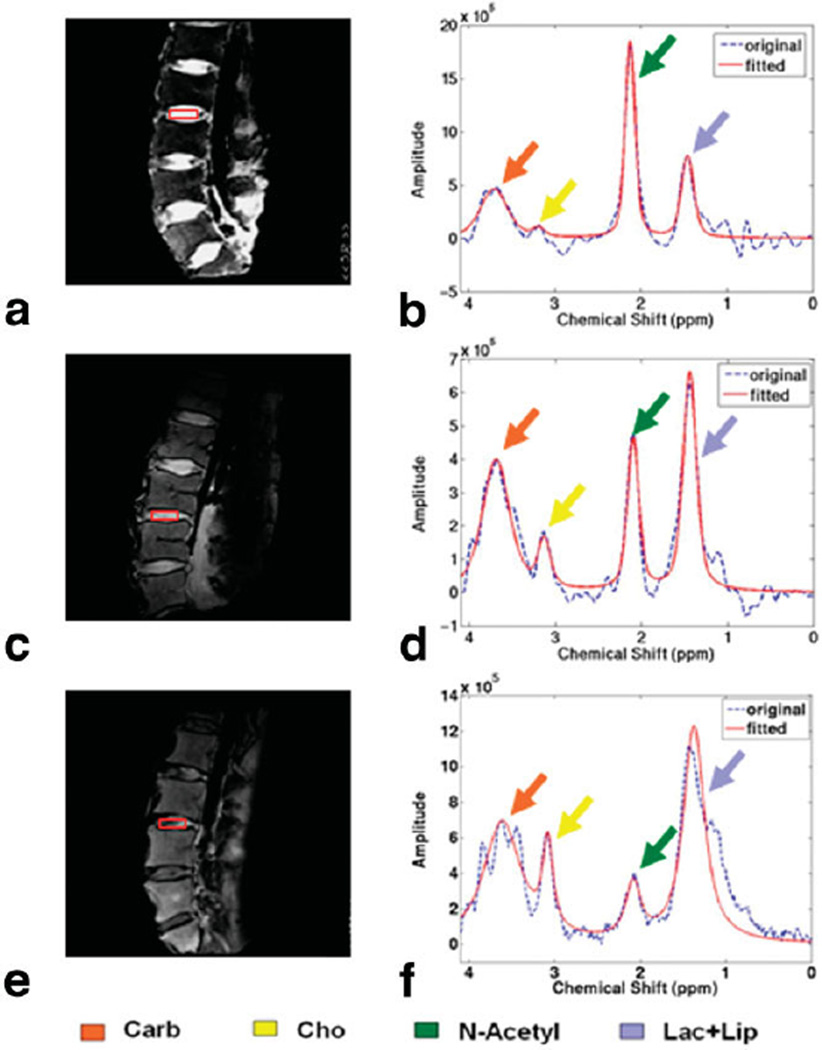
FIG. 4.
Representative T2-weighted images of Pfirrmann grade 1 (a), Pfirrmann grade 2 (c), Pfirrmann grade 3 (e), and the corresponding spectra (b,d,f) from cadaveric human discs of different Pfirrmann grade. Color arrows indicate the metabolite peaks. Note the decrease of N-acetyl and the increase of Cho and Lac+Lip with disc degeneration.

