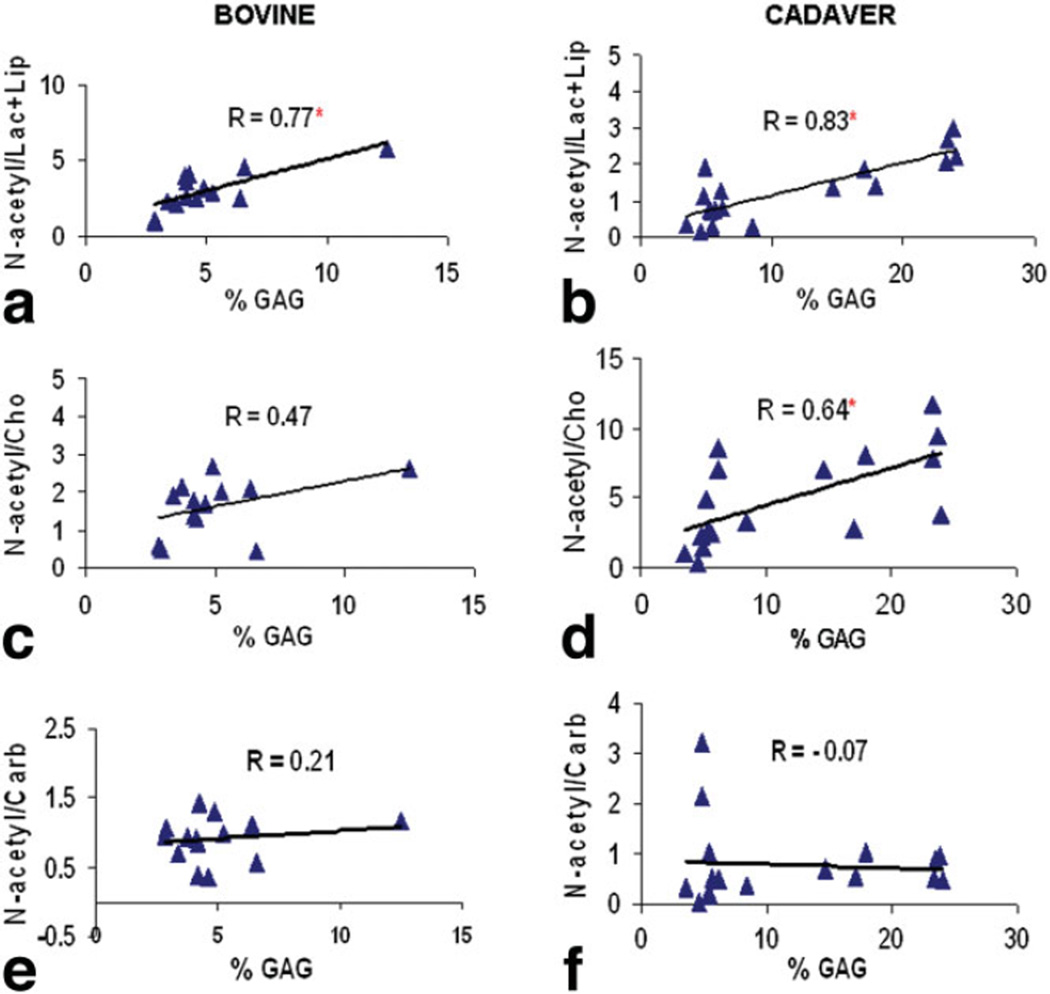
FIG. 6.
Biochemical analysis on bovine discs showed significant correlation between N-acetyl/Lac+Lip (R = 0.77, P = 0.0007) and GAG content (a); but not between N-acetyl/Cho and GAG content (R = 0.47, P = 0.15) (c) nor between N-acetyl/Carb and GAG content (R = 0.21, P = 0.46) (e). Biochemical analysis on cadaver discs showed significant correlations between N-acetyl/Lac+Lip (R = 0.83, P < 0.0001) and GAG content (b) as well as between N-acetyl/Cho and GAG content (R = 0.64, P = 0.0039) (d); but not between N-acetyl/Carb and GAG content (R = −0.07, P = 0.77) (f). *Indicates significant correlation. [Color figure can be viewed in the online issue, which is available at www.interscience.wiley.com.]

