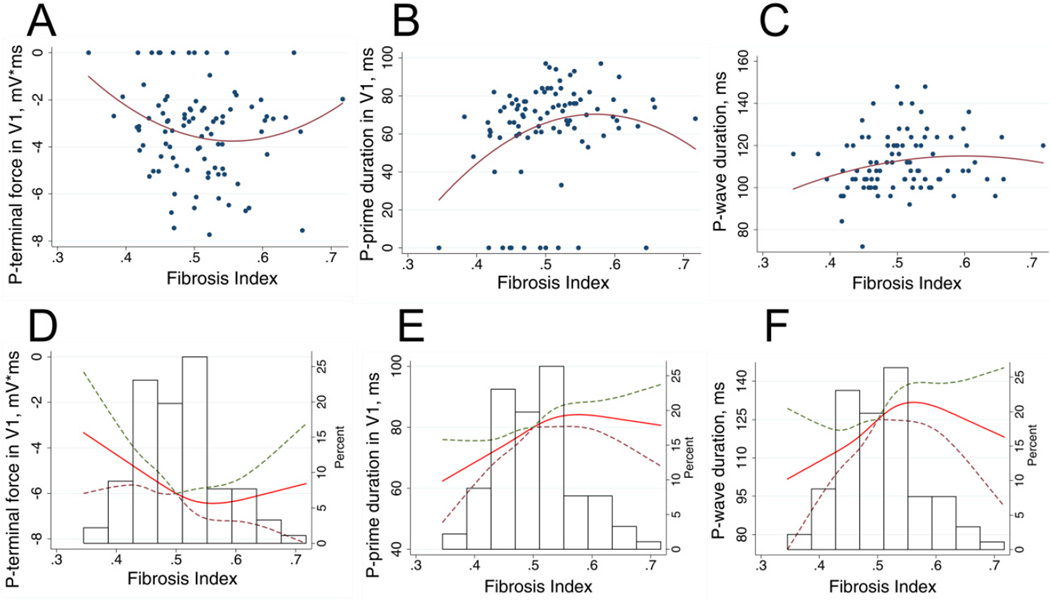
Figure 4.
Unadjusted (A–C) and adjusted (D-F) associations of P-wave indices and fibrosis. Scatterplots of (A) P-terminal force in V1, (B) P-prime duration in V1, (C) average P-wave duration (Y) against fibrosis index (X). Quadratic best fit line is shown. Cubic restricted splines depicting the association of (D) P-terminal force in V1, (E) P-prime duration in V1, (F) average P-wave duration and fibrosis index, adjusted by age, sex, race, body mass index, LA volumemax index and LV mass index. Dashed lines represent 95% confidence intervals surrounding the estimate.

