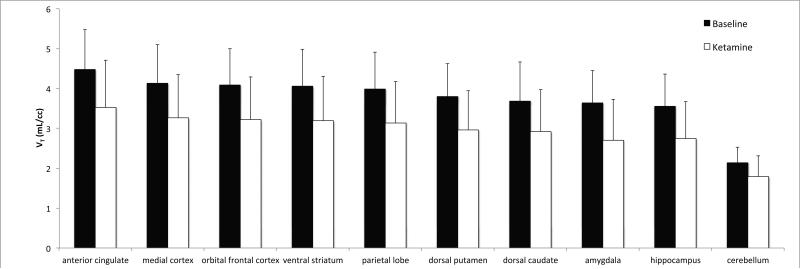
Figure 3.
Average Volume of Distribution (VT) across subjects (n = 10). Average values during the baseline scans (black bars) and challenge scans (white bars) are shown. Regions are organized from left to right in order of highest to lowest mean baseline binding. Differences in all regions shown are statistically significant (p<0.05, uncorrected) in post hoc testing. Error bars represent standard deviation across subjects.

