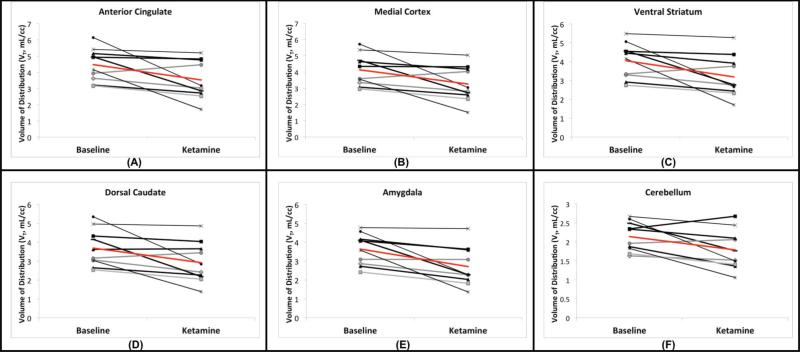
Figure 4.
Effects of Ketamine within each subject. The change in VT in high (anterior cingulate, a, medial prefrontal cortex, b, and ventral striatum, c) and low (dosal caudate, d, amygdala, e, and cerebellum, f) binding regions is shown. Each line segment represents a different subject. Average change is indicated in red.

