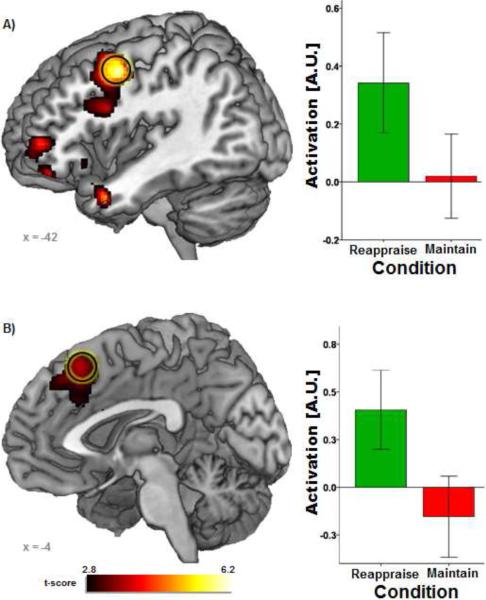
Figure 1.
Voxel-wise statistical t-map on a canonical brain displaying differences in neural responses for Reappraise-Neg vs. Maintain-Neg. All voxels were significant at p < .005 (uncorrected) with cluster extent threshold greater than 20 contiguous voxels. Bar graphs illustrate extracted parameter estimates from the left DLPFC (top) and mPFC (bottom) for Reappraise-Neg vs. Look-Neut and Maintain-Neg vs. Look-Neut contrasts. AU = arbitrary units; DLPFC = dorsolateral prefrontal cortex; L = Look-Neut; M = Maintain-Neg; mPFC = medial prefrontal cortex; R = Reappraise-Neg.

