
Figure 7.
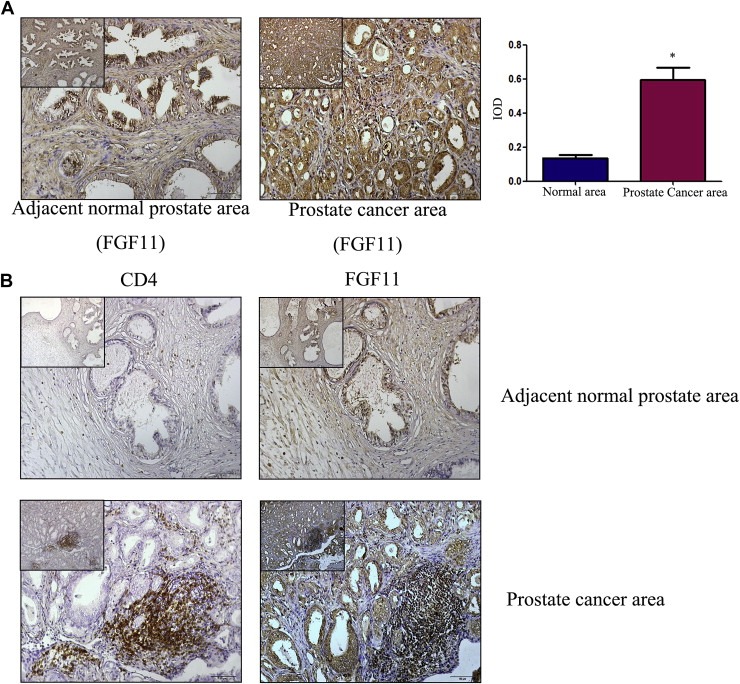
Expression of FGF11 in clinical samples. A. IHC staining for FGF11 in tissue specimens from 20 PCa patients. Compared to adjacent normal area (left panel), FGF11 expression was higher in the PCa area (right panel) (scale bar: 50 μm, the scale bar of upper left corners: 100 μm, *P < 0.05). B. Serial paraffin sections were used to detect the distribution of CD4(+) T cells and expression of FGF11 (Upper panels, adjacent normal area; lower panels, PCa area. Left panels CD4(+) and right labels FGF11, scale bar: 50 μm. The scale bar of upper left corners: 100 μm).