Figure 2.

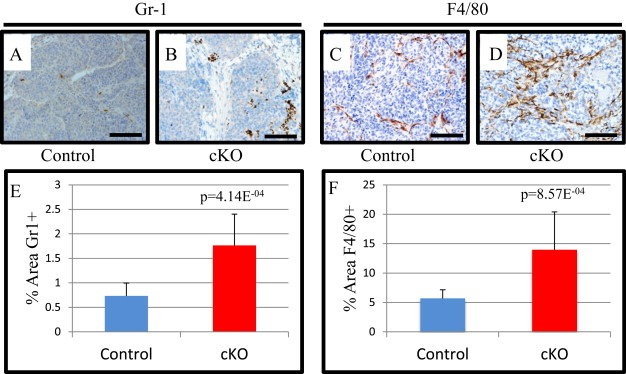
FSP1.cre mediated deletion of BMPR2 results in increased GR1+ and F4/80 positive cells. A–B) Representative images for control and cKO MMTV.PyVmT tumors stained for Ly6c/g(Gr‐1). C–D) Representative images of control and cKO tumors stained for the macrophage marker F4/80. E) Quantification of % area Gr‐1 immunohistochemistry in control and cKO tumors. F) Quantification of F4/80% area in control and cKO tumors. Scale bars = 100 μM. Significance was determined by students t‐test. Error bars indicate SD.
