Figure 3.

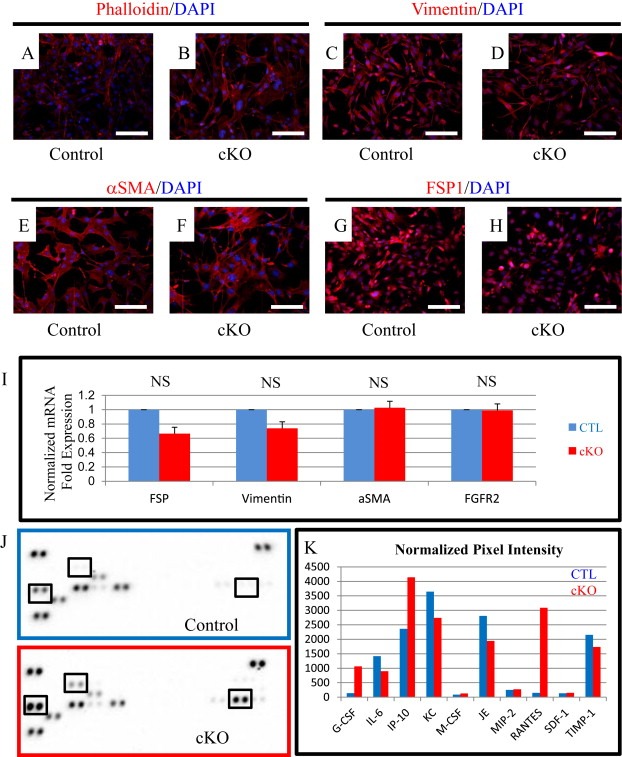
BMPR2 cKO fibroblasts have elevated inflammatory gene expression. A–F) Fibroblast cell lines were generated from control and cKO mammary glands and stained with Phalloidin (A–B), Vimentin (C–D), αSMA (E–F) and FSP1 (G–H) in red and counterstained with DAPI (blue). I) SYBR qPCR for fibroblast markers Fsp1, Vimentin, αSma, and Fgfr2 in control and cKO fibroblast cells. J–K) Mouse panel A cytokine array from RnD Systems with conditioned medium from control (blue) and BMPR2 cKO (red). K) Pixel intensity is quantified and normalized to average intensity of reference spots. mRNA is normalized to Gapdh levels and relative to control cells. Scale bars = 50 μM. Error bars indicate SEM. NS = Not Significant.
