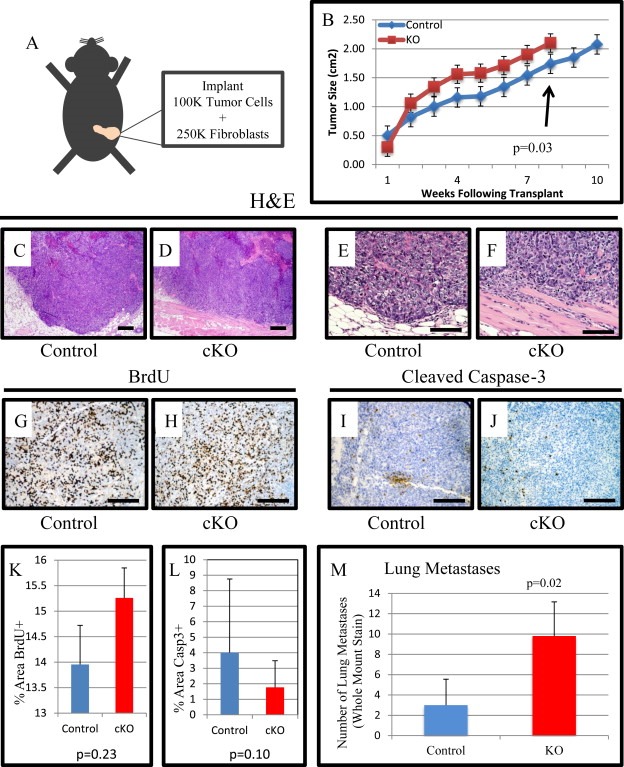
Figure 4.

Tumor implantation with fibroblasts accelerates tumor growth and metastases. A) Schematic representing implantation approach. 2.5 × 10⁵ fibroblasts were combined with 1 × 10⁵ PyVmT tumor cells and orthotopically implanted into 12‐week‐old virgin female mice left #4 mammary fat pads. B) Mice were palpated weekly and when palpable tumors were discovered they were measured with digital calipers for size. Mice continued to be measured until they reached the IACUC limit of 2 cm in primary tumor size and euthanized. C–F) Representative images of H&E staining for control and cKO implant tumors. G–H) Representative images of BrdU IHC for control and cKO implant tumors. I–J) Representative images of cleaved caspase‐3 IHC for control and cKO implant tumors. K–L) Quantification of BrdU and cleaved caspase‐3 IHC comparing control and cKO tumors. M) Average number of lung metastases per experimental group. Scale bars C–D = 200 μM, E–F = 50 μM G–J = 100 μM. Significance was determined by a students t‐test. Error bars indicate SD.
