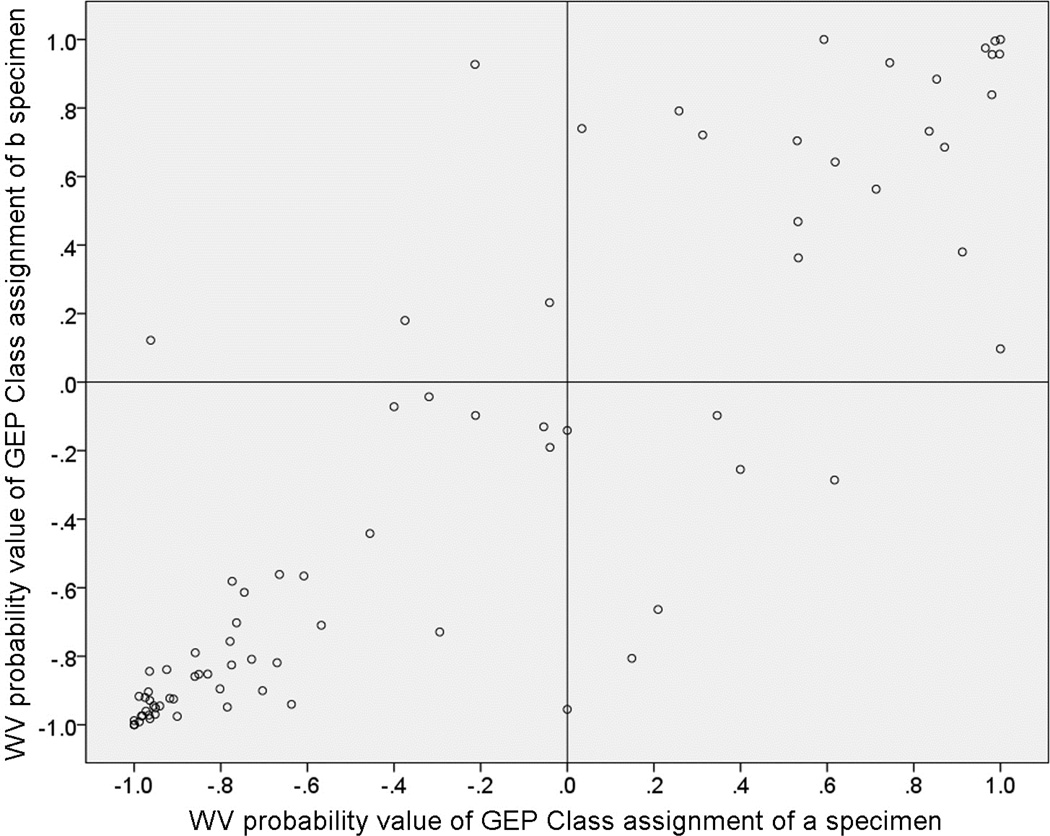
Figure 1.
Scatterplot of probability scores associated with gene expression profile (GEP) class assignment of “a” and “b” aspirates of 80 posterior uveal melanoma sampled in two sites by fine needle aspiration biopsy (FNAB) and classified using the weighted voting (WV) algorithm. Dots in the lower left box are concordant GEP class 1 cases, those in the upper right box are concordant GEP class 2 cases, and those in the upper left and lower right boxes are discordant cases.

