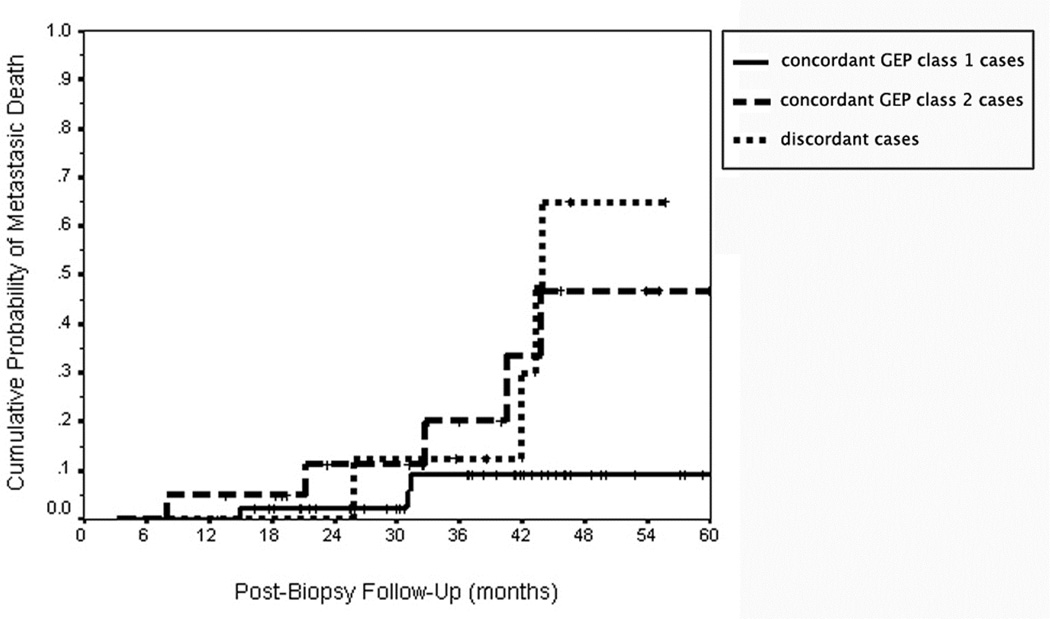
Figure 4.
Kaplan-Meier cumulative actuarial event rate curves for uveal melanoma death from metastasis in 80 patients with posterior uveal melanoma as a function of concordant versus discordant subgroup. Legend: continuous line = concordant gene expression profile (GEP) class 1 cases; dash line = concordant gene expression profile (GEP) class 2 cases; small-dash line = discordant gene expression profile (GEP) cases.

