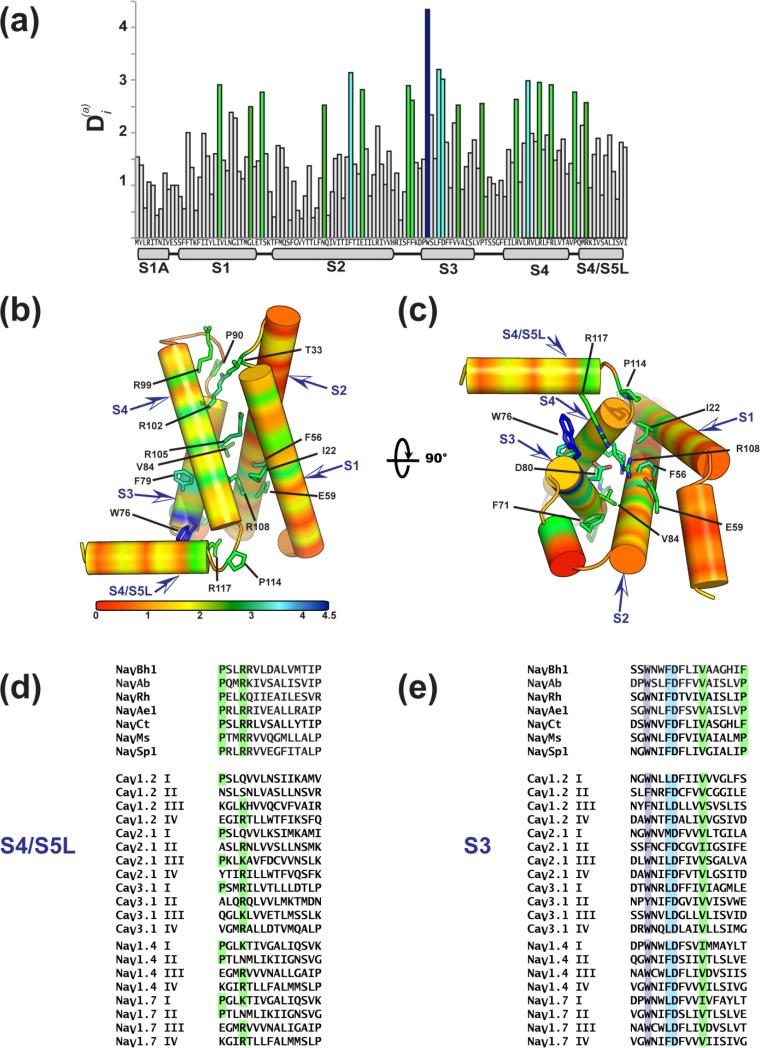
Figure 7. BacNaV VSD sequence conservation.
(a) Conservation analysis of the BacNaV VSD measured by the relative statistical entropy at each position, 115, mapped on the NaVAb sequence. Highly conserved positions are colored dark blue, light blue, and green. (b) and (c) Conservation analysis depicted on the NaVAb VSD. Select positions of interest are shown as sticks and are labeled. (d) Comparison of S4/S5 linker and (e) S3 segments for the indicated sequences: NaVBh1(NaChBac)(NP_343367.1) S3 87-113, S4/S5 linker 128-142; NaVAb (YP_001490668.1) S3 74-90, S4/S5 114-128; NaVRh (PDB:4DXW), S3 75-91, S4/S5117-133; NaVAe1 (YP_741167.1), S3 94-110, S4/S5 134-158; NaVCt (WP_007502948.1) S3 90-105, S4/S5 131-145; NaVMs (YP_864725.1), S3 75-91; S4/S5 linker 115-129; NaVSp1 (YP_165303.1), S3 73-89, S4/S5 112-126; CaV1.2 (CAA84346), IS3 193-209, IS3 586-602, IIIS3 967-983, IVS3 1281-1297, IS4/S5 252-66, IIS4/S5 265-649, IIIS4/S5 1013-1027, IVS4/S5 1344-1358; CaV2.1 (NG_011569.1), IS3 167-183, IIS3 549-565, IIIS3 1311-1327, IVS3 1628-1644, IS4/S5 210-224, IIS4/S5 598-612, IIIS4/S5 1361-1375, IVS4/S5 1676-1690; CaV3.1 (O43497), IS3, 150-166, IIS3 805-821, IIIS3 1344-1360, IVS3 1673-1689, IS4/S5 195-209, IIS4/S5 850-864, IIIS4/S5 1396-1410, IVS4/S5 1727-1741; NaV1.4 (NP_000325.4), IS3 191-207, IIS3 640-656, IIIS3 1095-1111, IVS3 1414-1430, IS4/S5 234-248, IIS4/S5 684-698, IIIS4/S5 1144-1158, IVS4/S5 1466-1480; NaV1.7 (NM_002977), IS3 186-202, IIS3 795-811, IIIS3 1245-1261, IVS3 1565-1581, IS4/S5 229-243, IIS4/S5 839-853,IIIS4/S5 1294-1308, IVS4/S5 1617-1631.

