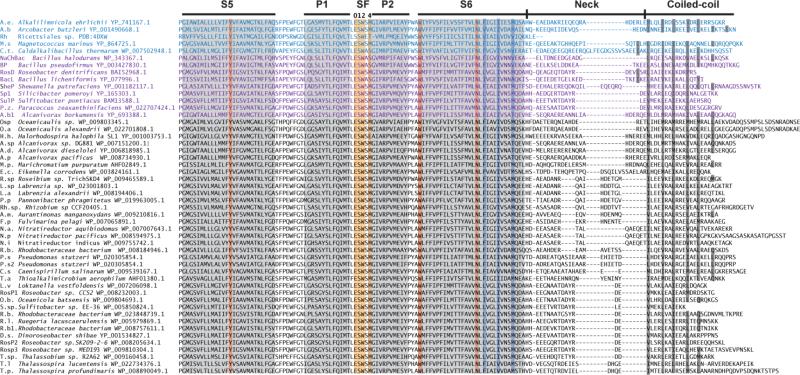
Figure 8. BacNaV PD and CTD sequence comparison.
S5, selectivity filter (SF), S6, Neck, and coiled-coil regions are indicated. 3-4 hydrophobic repeats of the coiled coils are indicated in grey. Conserved positions in S5, SF, and S6 are highlighted orange. Residues lining the pore are highlighted in blue. SF filter positions are indicated. Blue sequences have structures determined. Purple sequences have reported functional studies.

