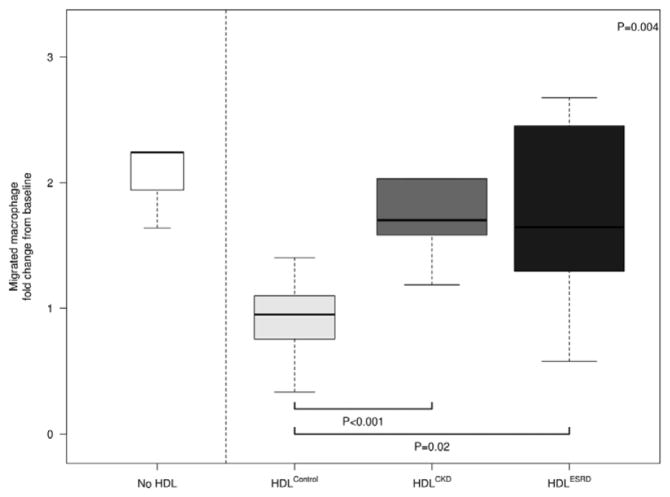
Figure 2.
Chemotactic effects of HDLControl, HDLCKD and HDLESRD. THP-1 cells in the upper compartment of a microchemotaxis chamber are separated by a filter from the lower compartment containing MCP-1. N=7, 13, 13 for HDLControl, HDLCKD and HDLESRD, respectively. Bars show median and interquartile range values. Comparison of HDL effects among control, CKD, ESRD subjects used Kruskal-Wallis test (p value shown in upper right corner of each panel) and unpaired t-test (shown as bars between individual groups).

