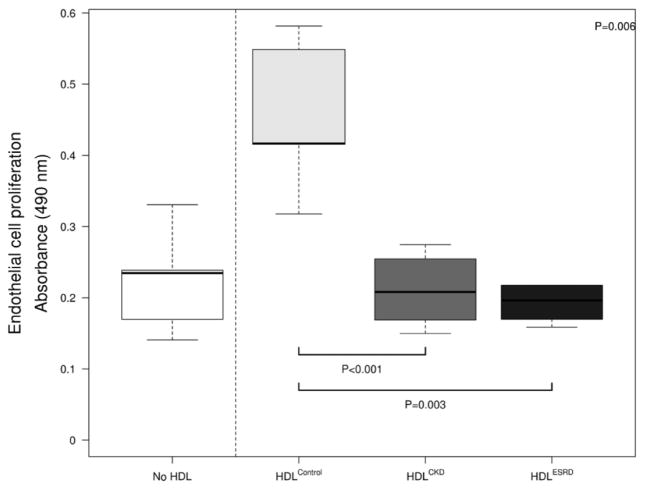
Figure 5.
Endothelial cell proliferation showing impaired proliferation effects of HDLCKD and HDLESRD. Due to limited sample volumes, HDL samples were pooled in each group using the same quantity of HDL protein concentration; each experiment was done in triplicate and repeated 2–4 times. Bars show median and interquartile range values. Comparison of HDL effects among control, CKD, ESRD subjects used Kruskal-Wallis test (p value shown in upper right corner) and unpaired t-test (shown as bars between individual groups).

