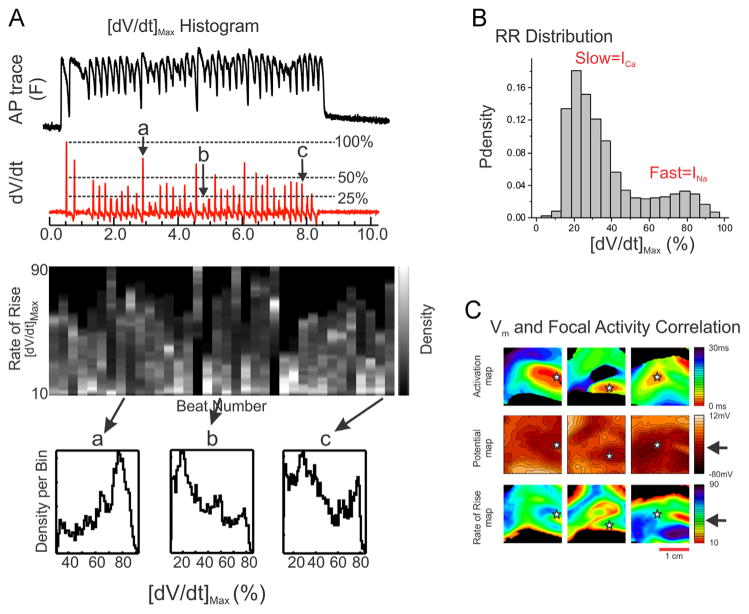
Figure 5.
Bimodal distribution of action potential upstrokes in polymorphic ventricular tachycardia (pVT). A: Histograms of [dV/dt]max. A sample action potential trace and its first derivatives (red) are shown in the top panel. Histograms of [dV/dt]max from each action potential are shown in gray. Three sample histograms are shown in the bottom panel: rapid rise (a), slow rise (b), and both slow and rapid rise (c). B: Cumulative distribution of [dV/dt]max supports 2 distinct populations, suggesting the existence of both INa- & ICa-mediated excitation wavefronts in pVT. C: [dV/dt]max at the site of focal activity. Left: Maps of [dV/dt]max and takeoff potential of focal activity (marked by stars). Right: Histogram of [dV/dt]max from 266 focal activations. Mean value of [dV/dt]max was 23.5% ± 12.3%, suggesting the important role of ICa in initiating focal activity.

