
Figure 1.
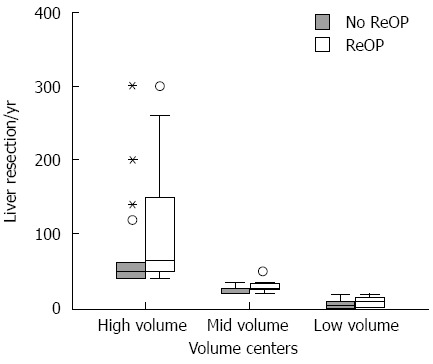
Box plots of the annual volume of liver resections, separated according to volume strata and occurrence of re-resection (T2-3 carcinomas). The middle bar of the box plot represents the median, while the lower and upper bars of the box represent the 25th and 75th quartiles, respectively. The dots and asterisks represent outliers.