
Figure 2.
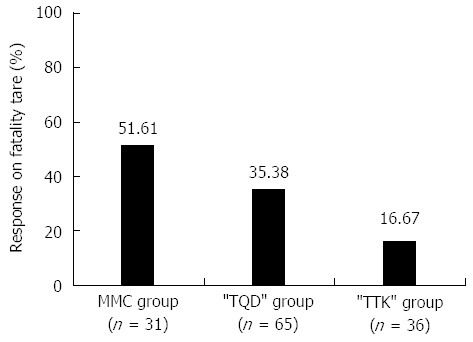
Fatality rates after 8-wk treatment and at 48-wk follow-up%. The figure showed the fatality rates of three groups: the fatality rate was lowest in the “TTK” group (16.67%); the fatality rate in the “TTK” group was significantly lower than those in the MMC group (16.67% vs 51.61%, P = 0.002) and “TQD” group (16.67% vs 35.38%, P = 0.046).