Figure 3.

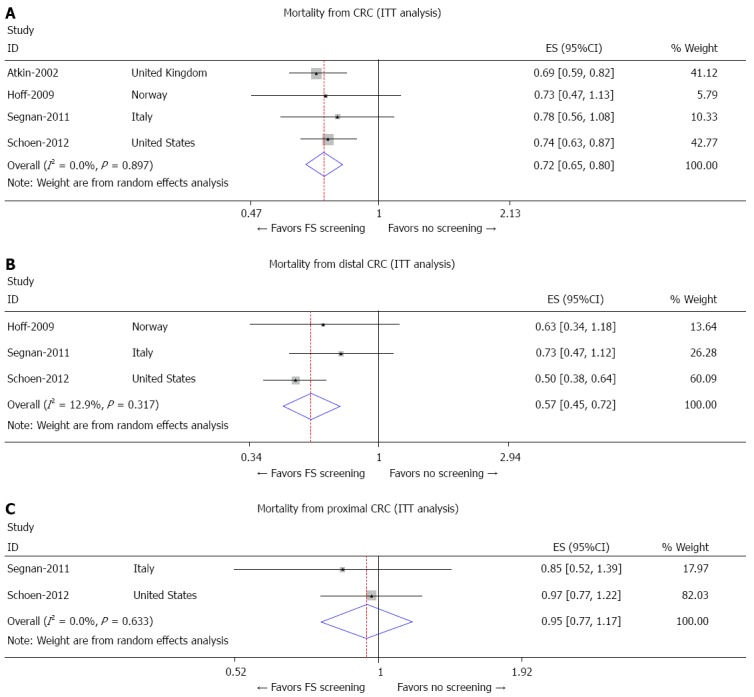
Forrest plots depicting mortality of total colorectal cancer (A), distal colorectal cancer (B), and proximal colorectal cancer (C). CRC: Colorectal cancer; ITT: Intention to treat; FS: Flexible sigmoidoscopy.

Forrest plots depicting mortality of total colorectal cancer (A), distal colorectal cancer (B), and proximal colorectal cancer (C). CRC: Colorectal cancer; ITT: Intention to treat; FS: Flexible sigmoidoscopy.