
Figure 1.
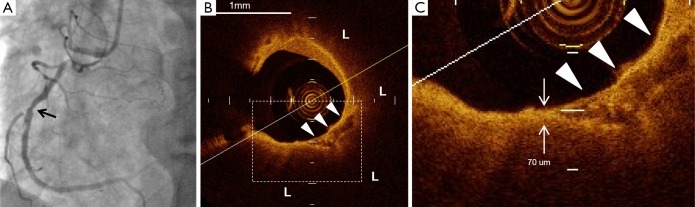
The representative images of plaque containing spotty calcification. (A) Coronary angiography demonstrated a non-culprit lesion at mid of the right coronary artery (arrow); (B) the corresponding FD-OCT image presents spotty calcification (arrow heads) within lipid plaque (L); (C) the thinnest fibrous cap (short arrow) was observed close to spotty calcification (arrow heads). Its thickness was 70 µm. FD-OCT, frequency-domain optical coherence tomography.