
Figure 7.
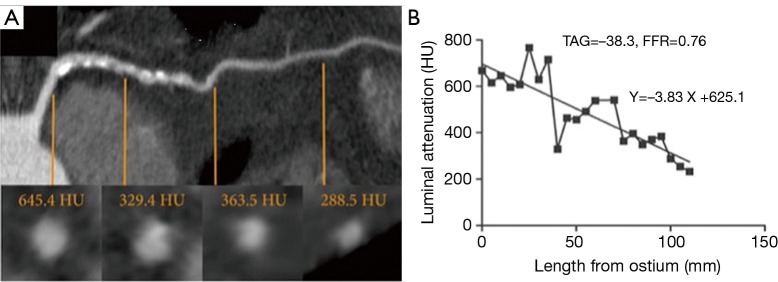
Transluminal attenuation gradient. Left anterior descending artery with significant obstructive plaque burden imaged by CCTA. Axial and representative cross-sectional views with corresponding luminal attenuation (HU) of CCTA. Black square dots represent 5 mm intervals at which intraluminal attenuation (HU) was measured. TAG was −38.3, and the FFR was 0.76. Adapted from (56). With permission from Elsevier. CCTA, coronary computed tomographic angiography; HU, Hounsfield units.