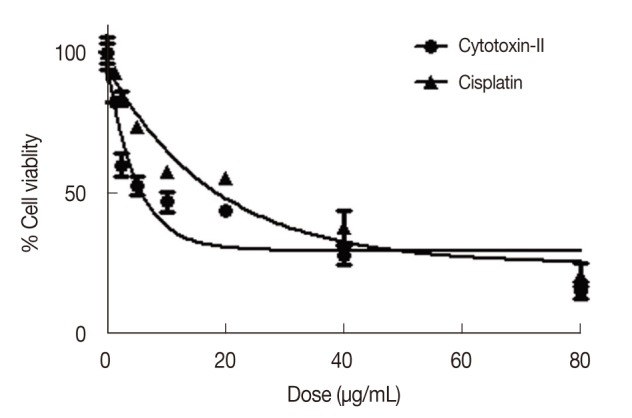
Figure 2.

Dose-response cell viability curves of cytotoxin-II and cisplatin in MCF7 cells. The cells were treated with different concentrations of cytotoxin-II and cisplatin for 24 hours and at the end of the incubation time, cell viability was determined by the MTT (3-(4,5-dimethylthiazol-2-yl)-2,5-diphenyltetrazolium bromide) reduction assay.
