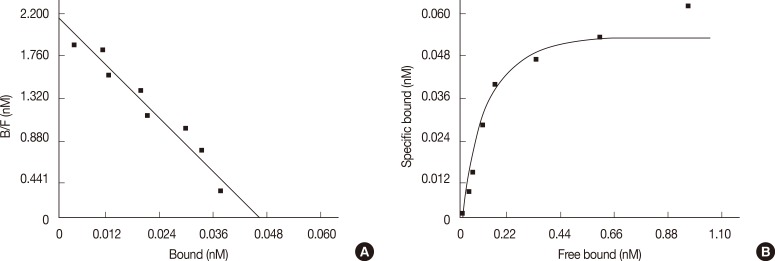
Figure 1.
Scatchard plot (A) and saturation curve of MCF-7 binding membranes (B). One hundred microliters of cell membrane suspension were incubated with increasing concentration (0.025-3.2 nM) of 3[H]RTX and in presence or in absence of 1 µM unlabelled RTX. The specific bound labeled ligand was determined by Scatchard analysis using GraphPad Prism Software (GraphPad Software) (n=8).
RTX=resiniferatoxin.

