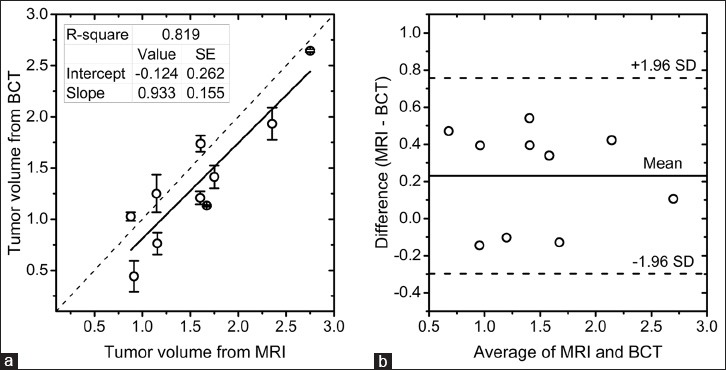
Figure 5.

(a) Linear regression analysis of pre-treatment tumor volumes from MRI and bCT. The tumor volumes from bCT are represented by the mean and ± 1 standard deviation of the estimates from automated and radiologist's segmentations. (b) Bland–Altman plot showing the agreement in tumor volumes between MRI and bCT. The tumor volumes are after logarithmic transformation.
