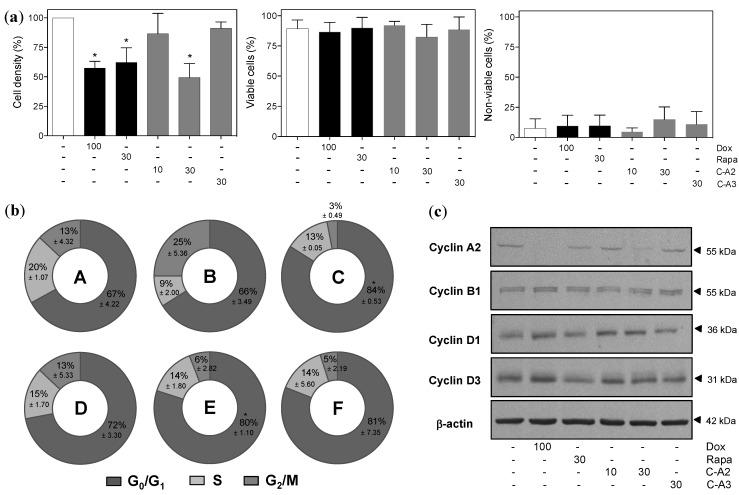
Figure 2.
Effect of chromomycin-A2 (C-A2) on cell viability and cell cycle progression of MALME-3M cells treated with controls, chromomycin A2 at 10 and 30 nM or chromomycin A3 at 30 nM for 48 h. (a) Flow cytometry analysis of cell density and cell viability with propidium iodide staining; (b) Doughnut graphs depicting distribution of cell cycle phases (A, DMSO; B, doxorubicin; C, rapamycin; D, chromomycin A2 10 nM; E, chromomycin A2 30 nM; F, chromomycin A3, C-A3, 30 nM); (c) Expression of key cell cycle regulating proteins by western blotting. DMSO (0.4% v/v) was used as negative control (−) and doxorubicin (100 nM) and rapamycin (30 nM) were used as positive controls. * p < 0.05. Data on graphs correspond to the mean ± standard error of the mean from at least three independent experiments.

