
Figure 5.
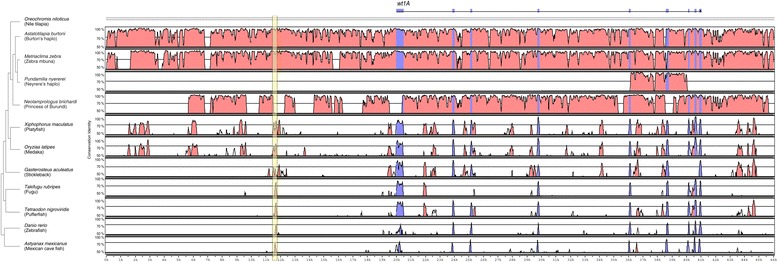
Comparison of the wt1A upstream region. Shuffle-LAGAN Vista plots [57,58] for wt1A. Peaks indicate conservation identity of sequences above 50% across the tested species. Blue stands for coding and pink for noncoding regions, respectively. The yellow block was investigated in the process of transcription factor binding site analysis (Table 2).