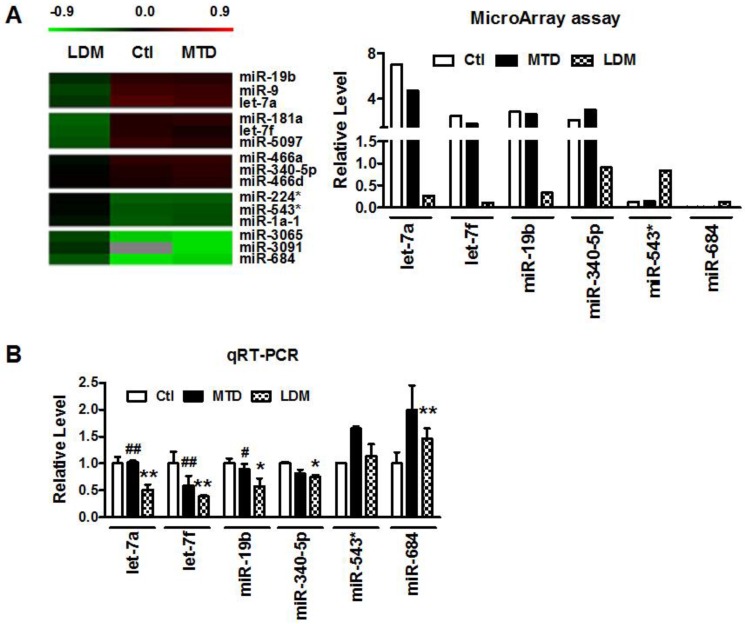
Figure 1.
Paclitaxel LDM therapy reduced let-7f expression in 4T1 breast tumors. A, The heat map of hierarchical clustering showed differential expression profiling of miRNAs from control, paclitaxel LDM therapy and MTD therapy groups. Red represents upregulated miRNAs, and green represents downregulated miRNAs (left). Altered expression profile of miRNAs in 4T1 breast tumors in three groups was analyzed by miRNA microarray (right). B, Quantitative real-time RT-PCR (qRT-PCR) verification of the miRNA expression profile in mouse models. ** P<0.01 vs control, ## P<0.01 vs MTD group. n=6 independent samples for each group.

