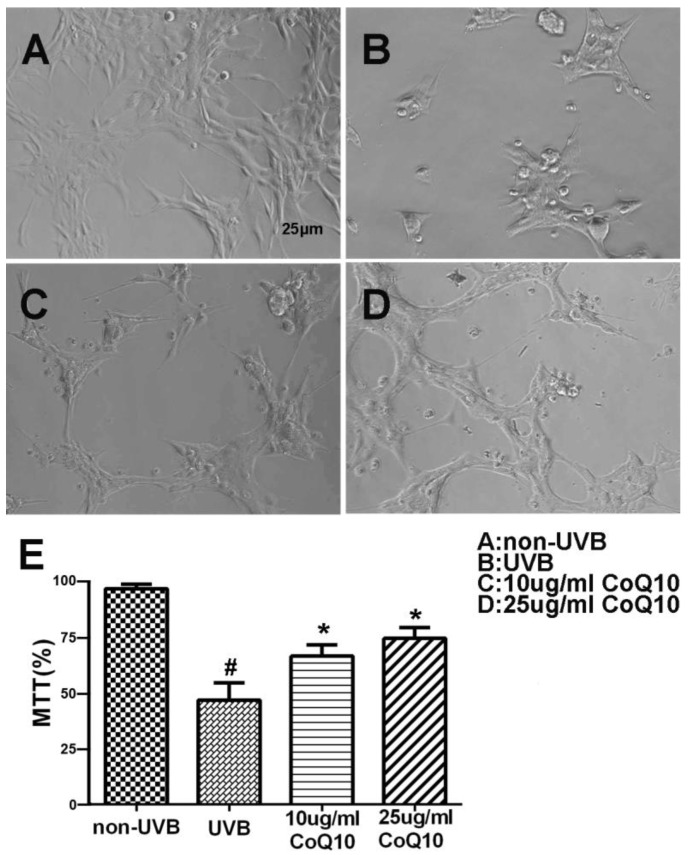
Figure 1.
Cell viability after CoQ10 treatment in UVB exposed astrocyte. (A-D) Original representative photomicrograms showing cell morphology in different groups; (E) MTT assay showing cell viability in experimental groups. Values are means s.d. from 3 independent experiments. #P < 0.01 vs. non-UVB control and *P < 0.05 vs. UVB. One-way ANOVA followed by Tukey's test. Data are presented as means ±S.D.

