Figure 1.
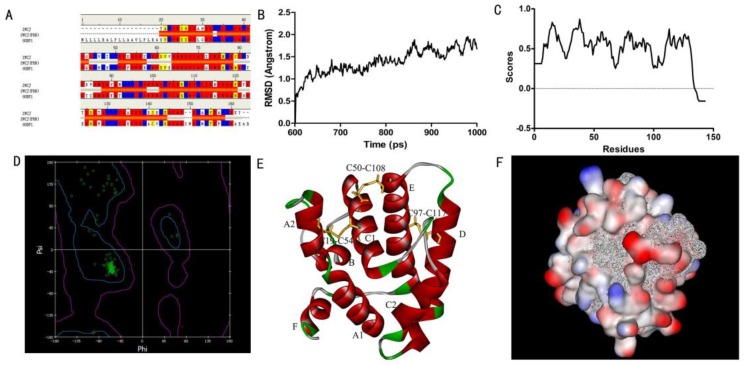
Three-dimensional (3D) model of SlitOBP1. (A)Sequence alignment of SiltOBP1 and BmorOBP. Strictly identical are highlighted with red background. (B) Root-mean square deviation obtained from the 1 ns molecular dynamics trajectory for SlitOBP1. (C) The Verify Score (Profile-3D) of the protein model of SlitOBP1. Residues with positive compatibility score are reasonably folded. (D) The Ramachandran plot of SlitOBP1. (E) The model of the SlitOBP1. Ribbon represented the selected conformer of the SlitOBP1. The three disulfide bridges are represented as yellow sticks. The secondary structures are labeled. A, B, C, D, E, F showed the six α-helices. (F) The hydrophobic and hydrophilic model of the SiltOBP1. The protein was folded and formed a spherical structure. The solid surface of the protein was covered by the hydrophilic residues, while the hydrophobic residues formed a hydrophobic cavity in inside of the protein (the white mesh surface).

