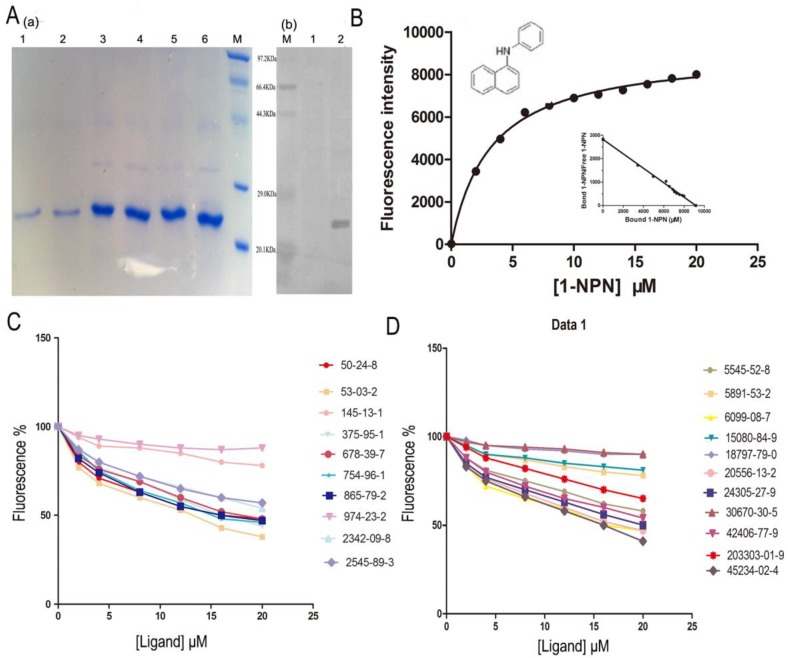
Figure 4.
Competitive binding study of SlitOBP1 to a series of selected compounds. (A) Expression and purification of SlitOBP1. (a) The blot showed one specific band at around 25 KDa in agreement with the predicted value. SlitOBP1 was induced and expressed in pET-28a vector. Purification was accomplished by HisTrap affinity columns; Lane 1-2 showed the protein after renaturation; Lane 3-6 showed purified inclusion body of the protein. M: molecular weight marker of 20.1, 29.0, 44.3, 66.4 and 97.3 KDa. (b) Western blot analysis of the SlitOBP. Immunoblotted with serum (diluted 1: 2000) and visualized by ECL. M: molecular weight marker of 20.1, 29.0, 44.3, 66.4 and 97.3 KDa. 1: control. 2: Purified protein. (B) The binding curve of 1-NPN and relative Scatchard plot analysis (inset). To measure the affinity of 1-NPN to SlitOBP1, the fluorescence of 2 μM 1-NPN in 50 mM Tris-HCl was excited at 337 nm and emission spectra were recorded between 350 nm and 480 nm. Then, 2 μM of protein was added and titrated with aliquots of 1 mM 1-NPN to final concentrations of 2 to 20 μM. The experiment was replicated for at least three times, and the data were analyzed using Prism software and indicated the presence of a single binding site. The dissociation constant was 3.237 (±0.20 SEM). (C)&(D) The solution was excited at 337 nm. Competitive binding of the selected ligands with SlitOBP1. Final solutions of 2 μM SlitOBP1 protein and 2 μM 1-NPN were titrated with 1 mM solution of each ligand in methanol to final concentrations of 0-20 μM. The figure reported averages of three replicates.

