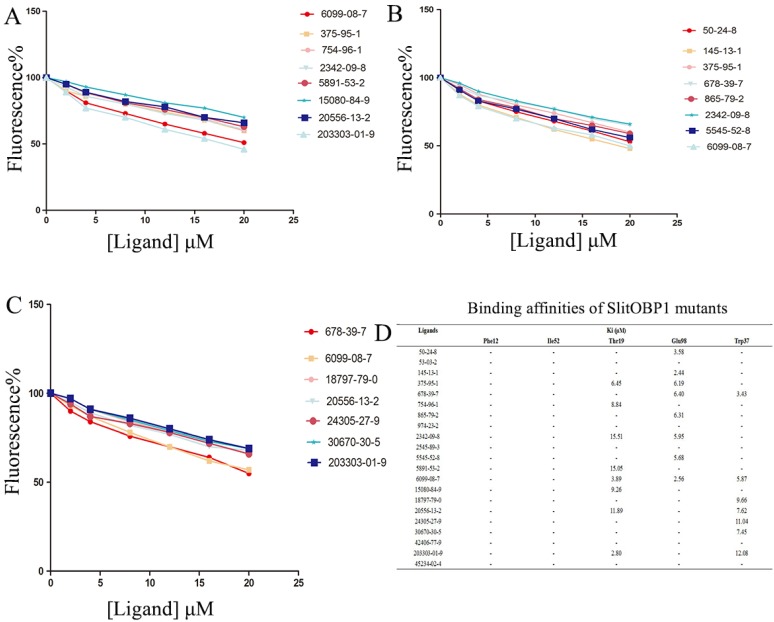
Figure 6.
Binding affinities of the ligands to the SlitOBP1 mutants. (A) Binding affinities of mutant Thr9. (B) Binding affinities of mutant Glu98. (C) Binding affinities of mutant Trp37. Final solutions of 2 μM SlitOBP1 protein and 2 μM 1-NPN were titrated with 1 mM solution of each ligand in methanol to final concentrations of 0-20 μM. The figure reported averages of three replicates. (D) The Ki values of the binding affinities. Values are means of three independent experiments. Ligands concentration > 20μM for half-maximal relative fluorescence intensity was represented as “-“.

