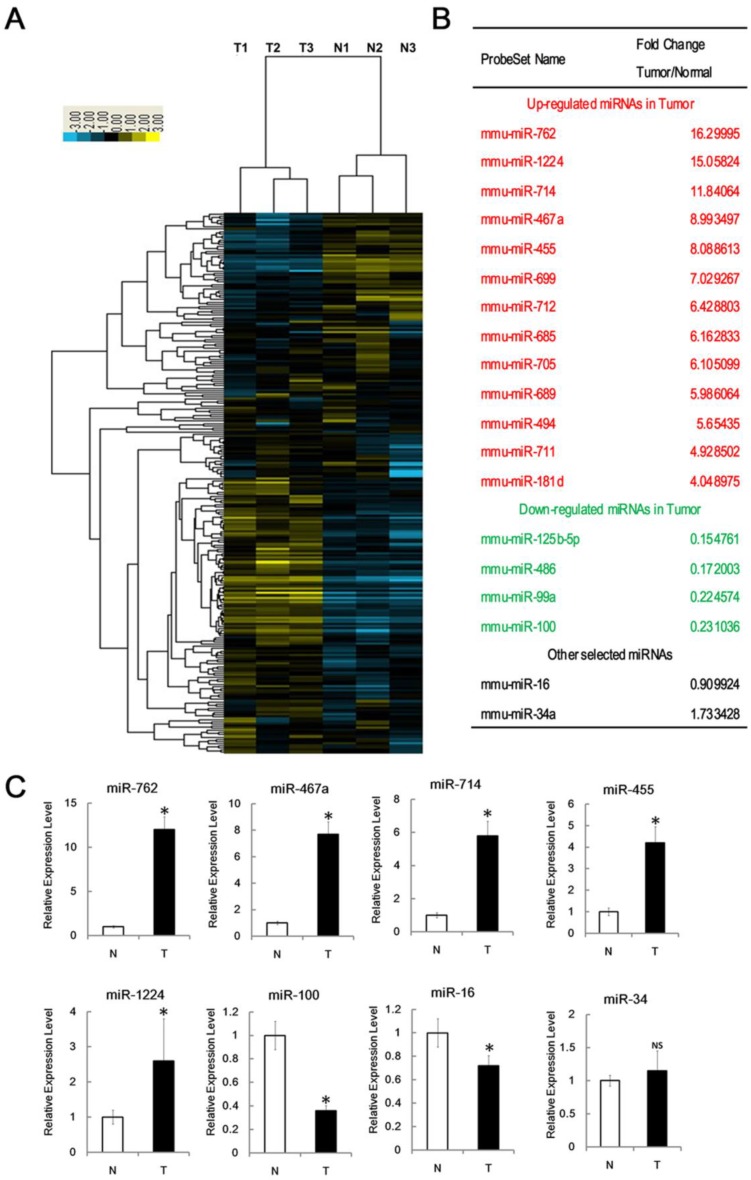
Figure 2.
Identification of miRNAs associated with RTL. (A) Tree generated from the hierarchical cluster analysis shows all differentially expressed mouse miRNAs in RTL tissues (T) versus normal tissues (N) using miRNA array (n=3 mice, each group). Yellow bar: upregulated miRNAs; Blue bar: downregulated miRNAs. (B) List of selected upregulated and downregulated miRNAs in RTL using SAM assays. (C) Q-PCR was performed to validate selected differentially expressed miRNAs using 18 paired samples of RTL tissue (T) and matched normal tissues (N). All data represent means ± SD. The relative expression levels of selected miRNAs are normalized by expression of the internal control, GAPDH. * p < 0.05. NS, no significant.

