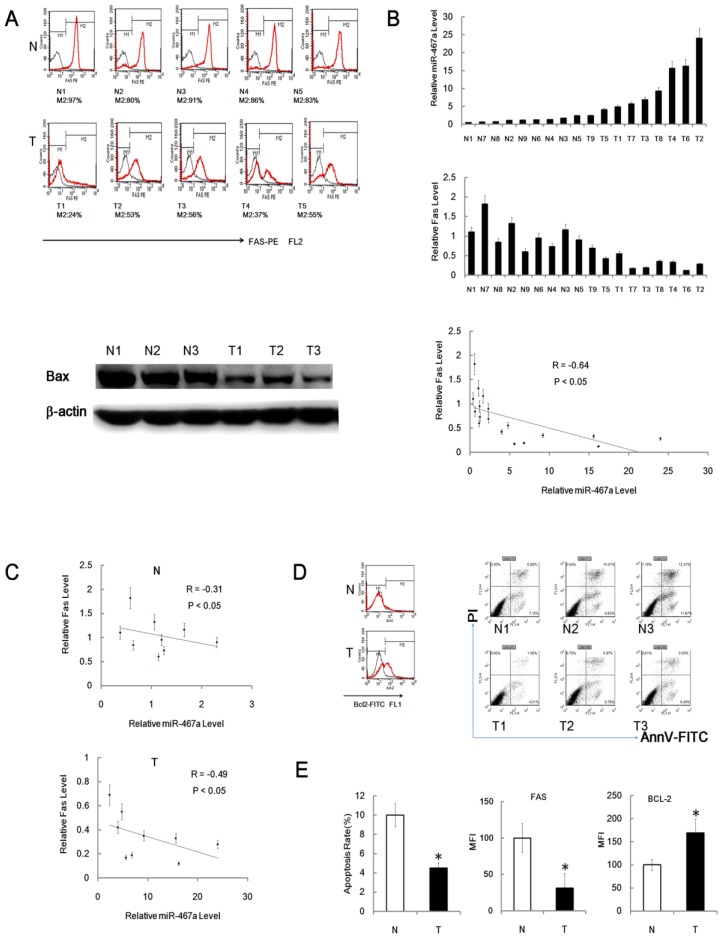
Figure 7.
Fas and Bax are downregulated in RTL. (A) Representative FACS assay of Fas positive (M2) cells from 5 paired RTL tissues (T) and normal thymus tissues (N). The black curves are isotype control, while M2 positive cell percentages are shown below each sample (upper panel). Representative immunoblotting analysis of Bax protein expression in 3 paired samples (lower panel). (B) Fas protein and miR-467a level were inversely correlated in 9 paired tumor tissues (T) and normal tissues (N). MiR-467a level was measured by q-PCR. Fas protein level is indicated as mean fluorescence intensity (MFI) detected by FACS assay. The graphs show the normalized expression levels of Fas protein and miR-467a relative to the median of normal thymus tissues (upper and middle panel). All data represent mean±SD of triple determinations. Each bar indicates the expression level in an individual case. The y axis represents the fold change. The overall inverse correlation curve between Fas protein and miR-467a level (lower panel). (C) The inverse correlation curves between Fas and miR-467a expression levels in tumor tissues (T) and normal tissues (N). R represents Spearman rank correlation coefficient. (D) Representative FACS assay of Bcl-2 positive (M2) cell and apoptosis status in tumor tissues (T) and normal tissues (N). (E) Left panel shows apoptosis rate of the cells from tumor tissues (T) and normal tissues (N) (n=9, each group) determined by FACS assay. Middle and right panels show MFI of Fas-PE and Bcl-2-FITC in the cells from indicated tissues (n=15, each group) detected by FACS assay. These data represent mean±SD. * p < 0.05.

