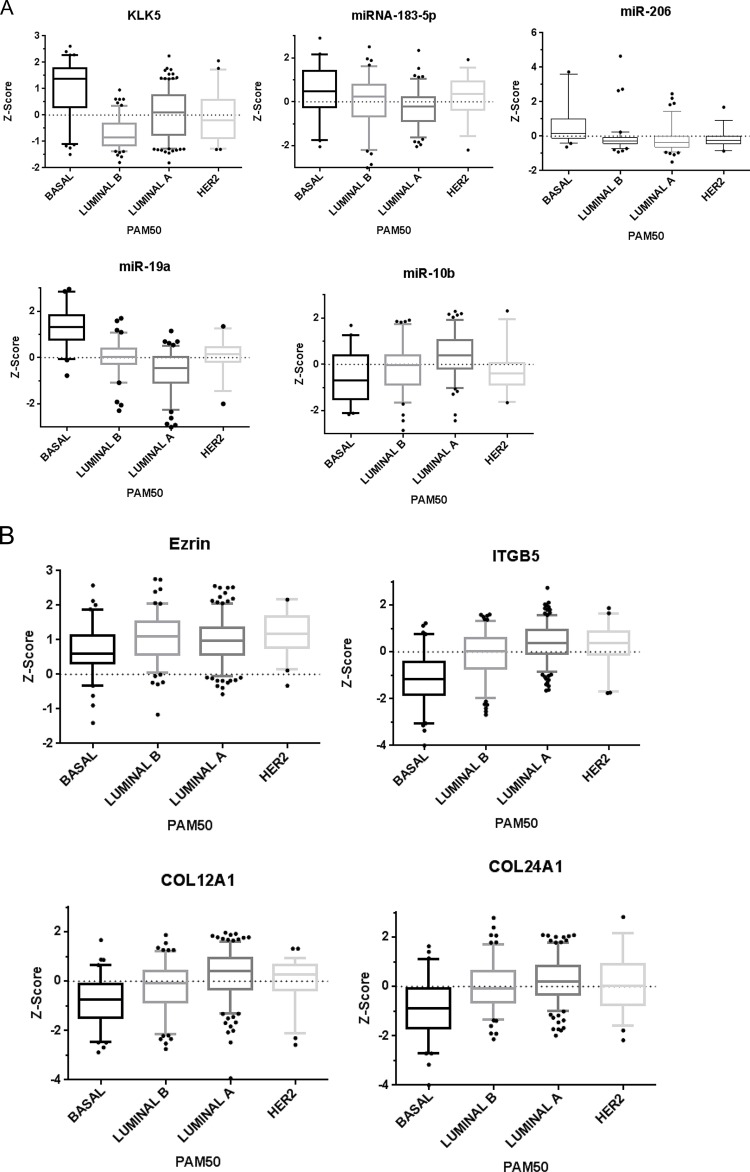
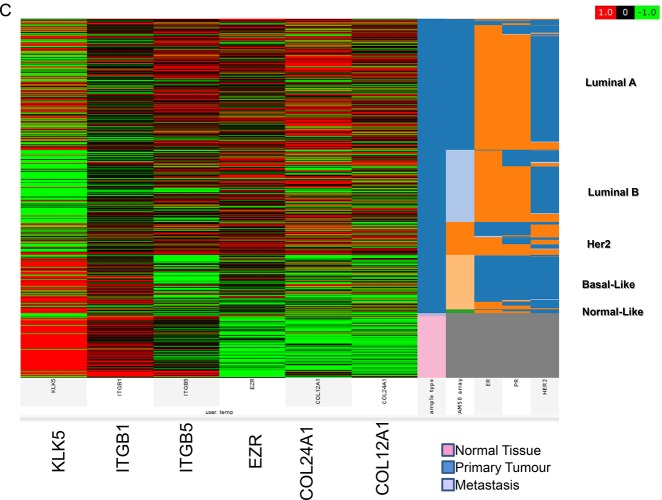
Figure 6. (A) KLK5 and KLK-regulated miRNA expression in invasive breast cancer subtypes.
Expression of KLK5 is significantly elevated in basal-like human breast cancers as compared to luminal B breast cancer subtypes. miR-183-5p, miR-206 and miR-19a expressions are significantly elevated in basal-like human breast cancers as compared to luminal B breast cancer subtypes, whereas miR-10b expression is significantly reduced in basal-like as compared to luminal B human breast cancer subtypes (p<0.0001). Data analyzed from TCGA [68]. 81 basal-like 129 luminal B, 232 luminal A, and 58 Her's-2 breast cancers. Data plotted as mean box & whisker plots, 5-95% CI with outliers shown. (B). KLK5 and KLK-regulated mRNA expression in invasive breast cancer molecular subtypes. A number of miRNA-mediated KLK5-regulated genes were found to have an inverse correlation with KLK5 expression in breast cancer subtypes. Expression of Ezrin is significantly reduced in basal-like human breast cancers as compared to luminal B breast cancer subtypes (A). ITGB1 expression is elevated in basal-like human breast cancers as compared to luminal B breast cancer subtypes (B). ITGB5 expression is significantly reduced in basal-like human breast cancers (Mean −0.8075) as compared to luminal B breast cancer subtypes (Mean −0.2960) (C). COL12A1 expression is significantly reduced in basal-like human breast cancers as compared to luminal B breast cancer subtypes (D). Similarly, COL24A1 expression is significantly reduced in Basal-like human breast cancers as compared to luminal B breast cancer subtypes (E). Data analyzed from TCGA [68]. 81 basal-like, 129 luminal B, 232 luminal A, and 58 Her-2 breast cancers. (p<0.0001). Data plotted as mean box & whisker plots, 5-95% CI with outliers shown. (C). Microarray visualization of KLK5 and KLK-regulated mRNA expression in invasive breast cancer molecular subtypes. IlluminaHiSeq data visualized using the Cancer Genomics Browser, n=1106 patients. Red indicates gene expression of +1 Z-score, green indicates −1 Z-score gene expression, and black indicates 0 Z-score. [68], [67]. Data plotted as Box and Whiskers Plot (5-95% with outliers plotted), data analyzed from TCGA. 81 basal-like, 129 Luminal B, 232 luminal A, and 58 Her-2 breast cancers.


