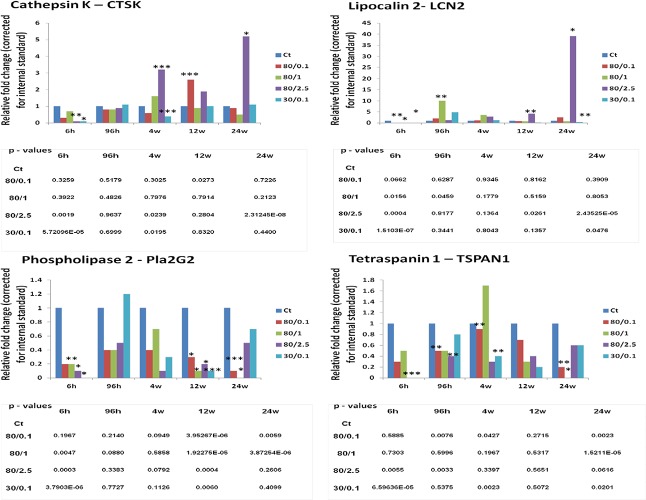
Figure 3. The altered levels of gene transcripts of cathepsin K, lipocalin 2, phospholipase 2, and tetraspanin 1 as detected by RT-PCR.
The data are shown as fold changes to respective controls. Each treatment group was compared to its corresponding control; B-actin was used as a reference gene (calculated by Pfaffl). P-values (in the tables below the graphs) were calculated by Student's t-test.

