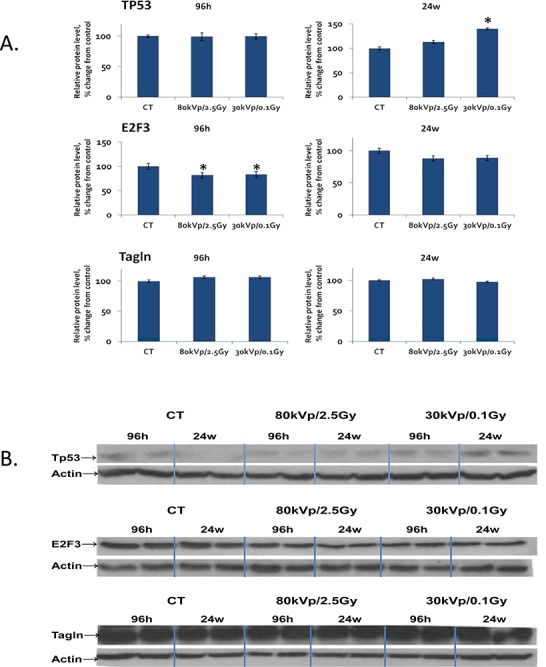
Figure 4. The levels of Tp53, E2F3 and transgelin protein in the rat mammary gland upon whole-body irradiation.

Protein levels relative to those of control non-irradiated animals are shown as Mean ± St Er. Representative blots are shown of two independent experiments. * - p < 0.05, the Student's t-test.
