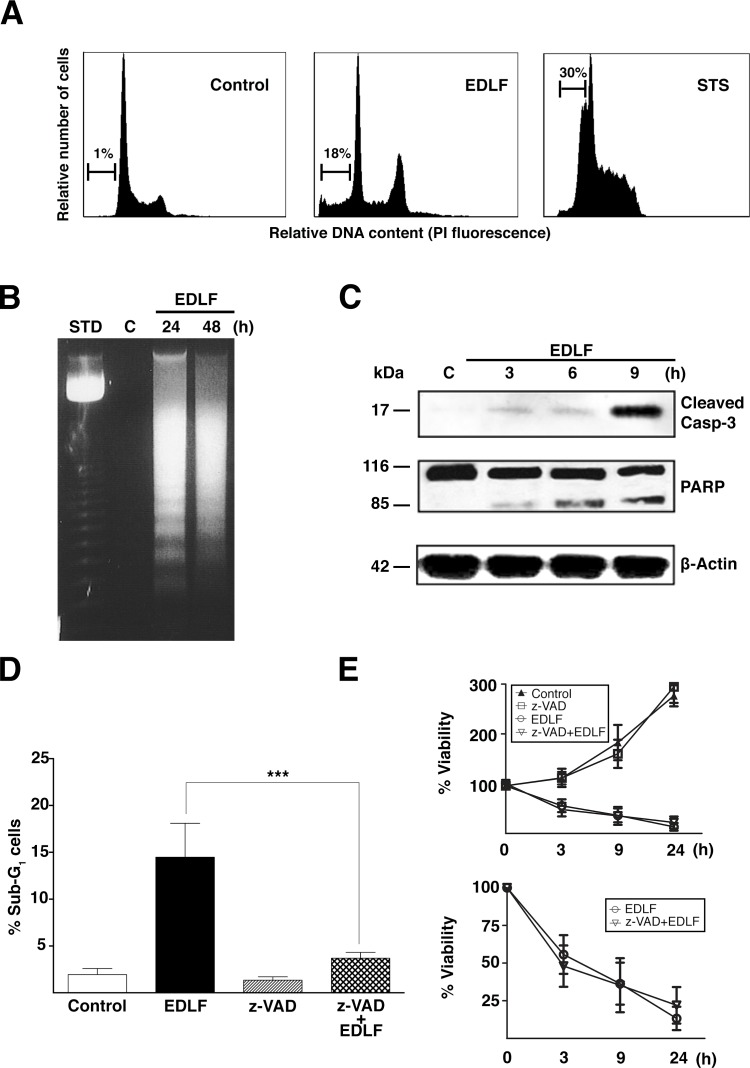
Figure 2. Edelfosine induces a minor apoptotic response in U118 cells.
(A) Representative cell cycle analysis histograms of untreated U118 cells (Control), U118 cells treated with 10 μM edelfosine (EDLF) for 24 h, and U118 cells treated with 0.5 μM staurosporine (STS) for 4 h. The percentage of apoptotic cells, identified as the sub-G1 population by flow cytometry, is indicated in each figure. (B) Cells treated with 10 μM edelfosine (EDLF) for 24 and 48 h were assayed for DNA fragmentation in agarose gels. Control untreated cells (C) were run in parallel in the same gels. A 123-bp DNA ladder was used as standard (Std). (C) Cells were untreated (Control, C) or treated with 10 μM edelfosine (EDLF) for the indicated times, and then analyzed by immunoblotting using specific antibodies against cleaved caspase-3 and PARP. Immunoblotting for β-actin was used as an internal control for equal protein loading in each lane. (D) Cells were preincubated without or with 100 μM pan-caspase inhibitor z-VAD-fmk (z-VAD) for 1 h, and then incubated in the absence (Control) or presence of 10 μM edelfosine (EDLF) for 24 h. Cells were analyzed by flow cytometry to evaluate apoptosis as the percentage of sub-G1 population in cell cycle analysis. Data shown are means ± SD of three independent experiments. ***, P<0.001 EDLF vs. z-VAD+EDLF, Student's t test. (E) MTT assays were conducted after culturing U118 cells without or with 100 μM pan-caspase inhibitor z-VAD-fmk (z-VAD) for 1 h, and then incubated in the absence (Control) or presence of 10 μM edelfosine (EDLF) at the indicated time points. Data are expressed as means ± SD of three independent experiments, each one performed in triplicate. The lower plot shows only the measurements for edelfosine- and z-VAD-fmk+edelfosine-treated cells for an easier appreciation of changes.

