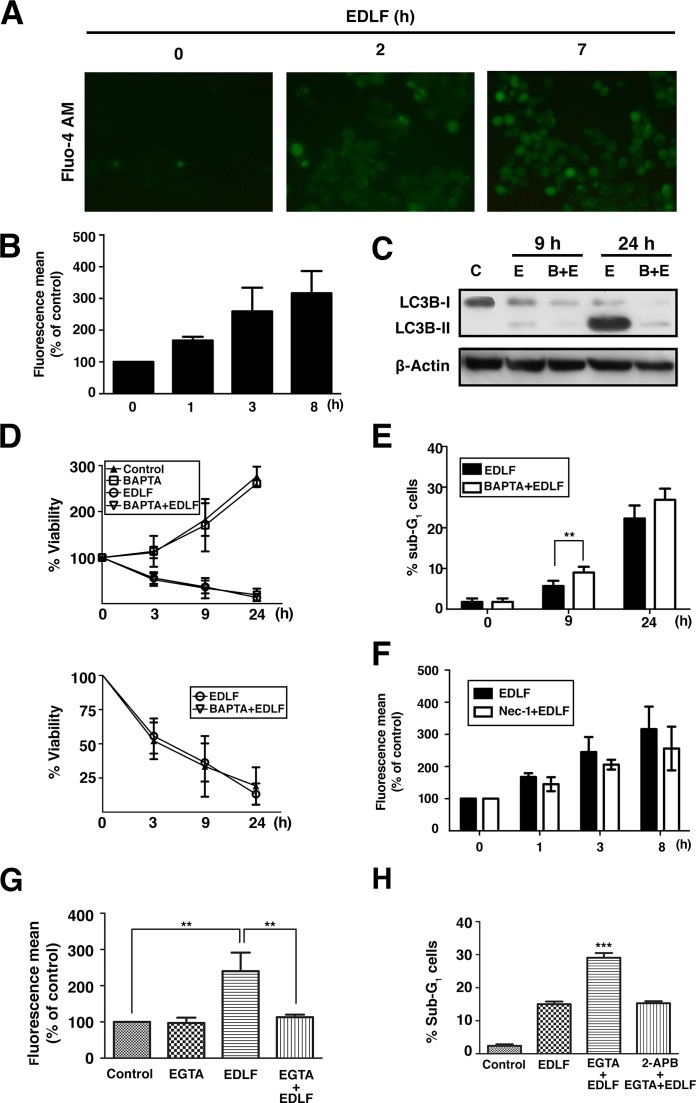
Figure 8. Changes in intracellular free calcium concentration in edelfosine-treated U118 cells.
(A) Cells were treated with 10 μM edelfosine (EDLF) for the indicated times followed by incubation with Fluo-4-AM for 30 min at 37°C, before being analyzed by fluorescence microscopy. (B) Cells were treated with 10 μM edelfosine (EDLF) for the indicated times, then incubated with Fluo-4-AM dye for 30 min and fluorescence intensity was measured by flow cytometry. (C) Untreated control cells (C), cells treated with 10 μM edelfosine (E) for the indicated times, or cells incubated with 4 μM BAPTA for 1 h and then treated with 10 μM edelfosine (B+E) for the indicated times, were analyzed by immunoblotting using a specific antibody for LC3B-I/II. (D) MTT assays were conducted after culturing U118 cells without or with 4 μM BAPTA-AM for 1 h, and then incubated in the absence or presence of 10 μM edelfosine (EDLF) at the indicated time points. Untreated control cells were run in parallel. Data shown are means ± SD of three independent experiments, each one performed in triplicate. The lower plot shows only the measurements for edelfosine- and BAPTA-AM+edelfosine-treated cells for an easier appreciation of changes. (E) Cells were preincubated without or with 4 μM BAPTA-AM for 1 h, and then treated with 10 μM edelfosine (EDLF) for the indicated time points and analyzed by flow cytometry to evaluate apoptosis. **, P<0.01 EDLF vs. BAPTA+EDLF, Student's t test. (F) Cells treated with 10 μM edelfosine for the indicated times without (EDLF) or with Nec-1 pretreatment (Nec-1+EDLF) were incubated with Fluo-4-AM for 30 min at 37°C, and fluorescence was measured by flow cytometry. (G) Cells incubated for 1 h without or with 10 mM EGTA, and then in the absence or presence of 10 μM edelfosine (EDLF) for 4 h, were incubated with Fluo-4-AM for 30 min and fluorescence was measured by flow cytometry. Untreated control cells were run in parallel. Data are expressed as means ± SD of three independent experiments. **, P<0.01, Student's t test. (H) Cells were pretreated with EGTA (10 mM) or 2-APB (60 μM) + EGTA (10 mM) for 1 h, and then incubated in the absence or presence of 10 μM edelfosine (EDLF) for 24 h, and analyzed by flow cytometry to evaluate apoptosis. Untreated control cells were run in parallel. Data are expressed as means ± SD of three independent experiments. ***, P<0.001 EGTA+EDLF vs. EDLF or 2-APB+EGTA+EDLF, Student's t test.

