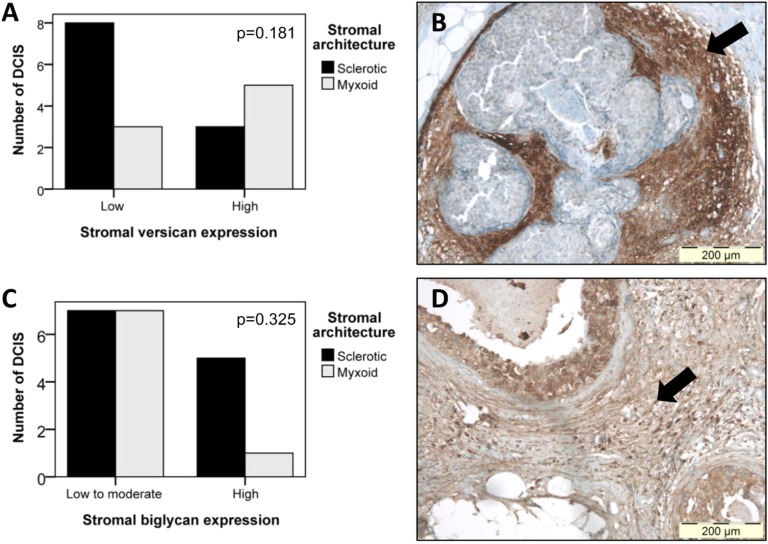
Figure 3. Comparison of stromal versican and biglycan expression in DCIS lesions with sclerotic or myxoid stroma.
(A) Bar chart displaying the relation between stromal versican expression and stromal architecture. Despite a trend toward high versican expression in DCIS with myxoid stroma, statistical significance was not reached (p=0.181), due to lack of power (β=0.803). (B) Photomicrograph displaying high periductal versican immunoreactivity (arrow) in a DCIS lesion with myxoid stroma. Original magnification 100x. (C) Bar chart illustrating the absence of any association (p=0.325) between stromal biglycan expression and stromal architecture. (D) Photomicrograph illustrating high periductal biglycan staining (arrow) in a DCIS lesion with myxoid stroma. Original magnification 100x.

