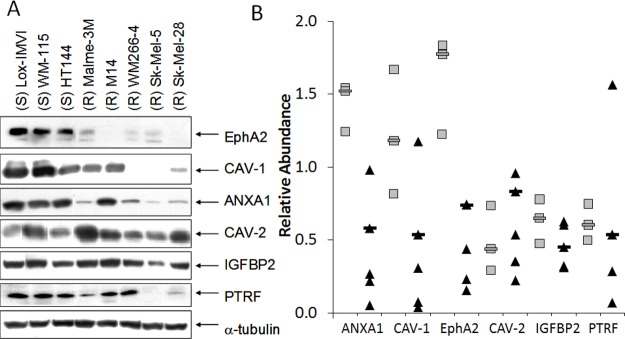
Figure 3A.
Immunoblotting for EphA2, CAV-1, ANXA1, CAV-2, IGFBP2 and PTRF in dasatinib sensitive (S) and dasatinib resistant (R) melanoma cell lines. 3B: Expression levels of ANXA1, CAV-1, EphA2, CAV-2, IGFBP2 and PTRF candidate markers measured by densitometry from triplicate western blots. Grey squares represent the average expression of triplicate analysis of individual dasatinib sensitive cell lines compared to the expression in the dasatinib resistant cell lines represented by black squares. ‘—’ indicates that the median result of either dasatinib sensitive or dasatinib resistant cell lines.

