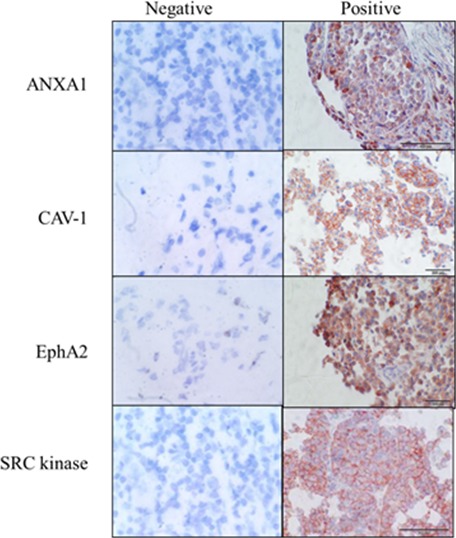
Figure 4. Representative immunohistochemical staining of melanoma samples showing ANXA1, CAV-1, EphA2 and SRC kinase positive staining.
Negative controls represent melanoma samples where no staining is observed in tumour cells. Scale bar - 200 μM, original magnification – 200X. All sections were counterstained with haematoxylin.

