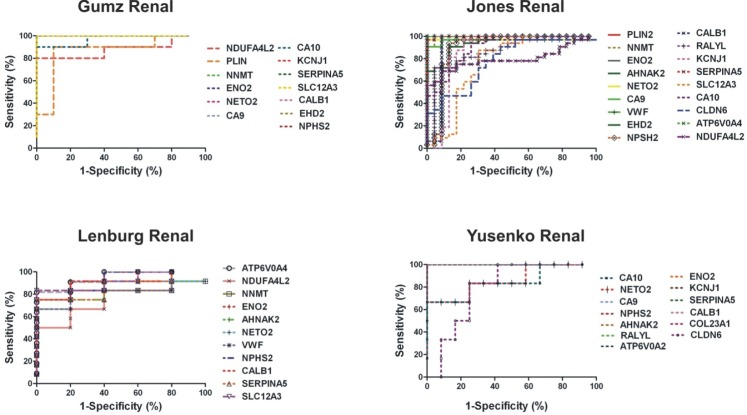
Figure 7. ROC analysis of the top 20 DEGs in ccRCC vs. the normal kidney using each datasets extracted MAS5- calculated signal intensity values.
Of them, the DEGs with a p<0.01 and an AUC>0.8 were selected as successful distinguishing markers between ccRCC and the normal kidney tissues.In the “Gumz Renal” dataset, NDUFA4L2, PLIN2, NNMT, ENO2, CA9, CA10, KCNJ1, SERPINA5, SLC12A3, CALB1, EHD2 and NPHS2 showed a median AUC=1.00 and p<0.01. In the “Jones Renal” dataset, PLIN2, NNMT, ENO2, AHNAK2, NETO2, CA9, VWF, EHD2, NPHS2, CALB1, RALYL, KCNJ1, SERPINA5, SLC12A3, CA10, CLDN6, ATP6V0A4 and NDUFA4L2 had median AUC=0.969 (p<0.001) and in the “Lenburg Renal” dataset, NDUFA4, NNMT, ENO2, AHNAK2, NETO2, VWF, NPHS2, CALB1, SERPINA5, SLC12A3 and ATP6V0A4 exhibited median AUC=0.90 (p<0.001). In the Yusenko dataset, CA10, NETO2, CA9, NPHS2, AHNAK2, RALYL, ATP6V0A4, ENO2, KCNJ1, SERPINA5, CALB1, COL23A1 and CLDN6 had median AUC values of 1.000 (p<0.01).

